4 Using Advanced Report Techniques
In this tutorial, you create an application that highlights some of the more advanced interactive reporting techniques.
The following procedures are described:
-
Augmenting the report to include data from other tables.
-
Adding a navigation link from the home page to an interactive report.
-
Creating a column link from one interactive report to another.
-
Passing column values from one interactive report to another.
-
Querying an interactive report for column values.
This tutorial contains the following topics:
Create the Basic Application
In this section, you create the database objects, load them with sample data and create the basic application. The Create Application Wizard is used to build the application containing a Home page and an Issues report page. The Issues report page enables users to view issues stored in the IT_ISSUES table.
This section includes the following topics:
Create and Populate the Database Objects
Before you begin creating the application, you need to create the appropriate sample objects within your workspace and load them with demonstration data.
To install the Issue Tracker sample objects:
-
Create the Issue Tracker data objects. Follow instructions outlined in "Create and Run a Script to Build Database Objects" .
-
Load objects with demonstration data. Follow instructions described in "Loading Demonstration Data" .
These sample objects are copies of the Issue Tracker application objects. For a complete description of the Issue Tracker application see Chapter 14, "How to Design an Issue Tracking Application" and Chapter 15, "How to Build and Deploy an Issue Tracking Application".
Create the Application
Now, you create an application using the Create Application Wizard.
To create an application with a Home page and an Issues Report page:
-
On the Workspace home page, click the Application Builder icon.
-
Click Create.
-
For Method, select Create Application and click Next.
-
For Name, make these changes:
-
Name - Enter
Advanced Reports. -
Create Application - Select From scratch.
-
Schema - Select schema containing loaded IT data objects.
-
Click Next.
-
-
Under Add Page, make these changes:
-
Select Page Type - Select Blank.
-
Page Name - Enter
Home. -
Click Add Page.
-
-
Under Add Page, make these changes:
-
Select Page Type - Select Report.
-
Subordinate to Page - Select Home (1).
-
Page Source - Select Table.
-
Table Name - Select IT_ISSUES.
-
Implementation - Select Interactive.
-
Click Add Page.
-
-
Under Create Application, click the It_Issues link.
The New Page Definition window appears.
-
Under Page Definition, for Page Name, enter
Issues. -
Under Report Columns, for Show select No for each of the following columns then click Apply Changes:
-
ISSUE_DESCRIPTION
-
TARGET_RESOLUTION_DATE
-
PROGRESS
-
ACTUAL_RESOLUTION_DATE
-
RESOLUTION_SUMMARY
-
CRETATED_ON
-
CREATED_BY
-
MODIFIED_ON
-
MODIFIED_BY
-
-
Click Next.
-
For Tabs, select No Tabs and click Next.
-
For Shared Components, accept the default, No, and click Next.
-
For Attributes, accept all defaults and click Next.
-
For User Interface, select Theme 20 and click Next.
-
Review application attributes and click Create.
Run the Application
Now, run the Advanced Reports application and view the Home page, Issues Reports page and Single Row View.
To run the application:
-
Click the Run Application icon.
-
When prompted, enter your workspace user name, your password and click Login.
This authentication is part of the default security of any newly created application. See "About Application Authentication".
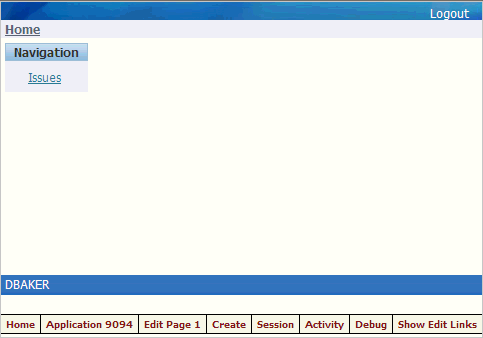
As shown in Figure 4-1, the home page appears.
-
Click the Issues link.
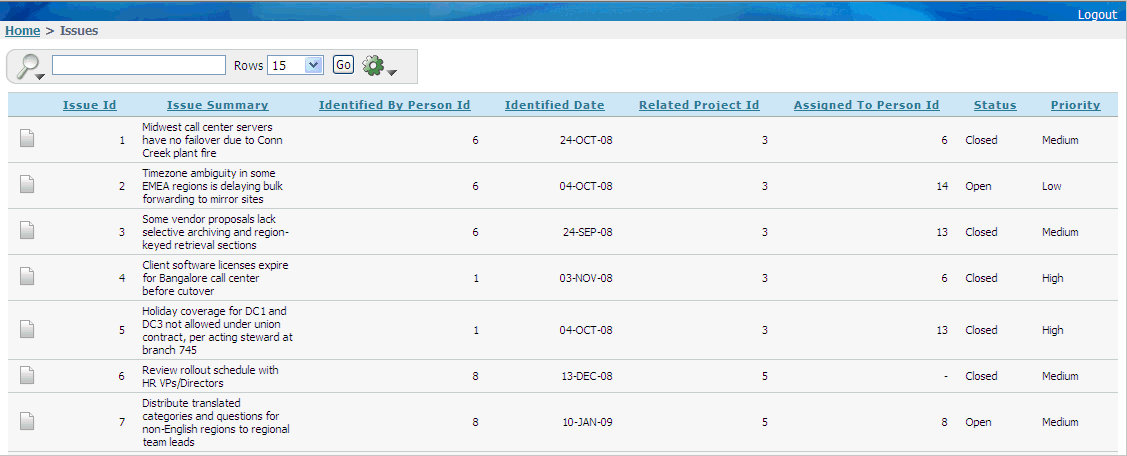
The Issue report page displays as shown in Figure 4-2, "Initial Issues Report".
-
Locate the Link Column icon for Issue Id 1 as shown in Figure 4-3, "Single Row View Icon".
-
Click the Link Column icon for Issue Id 1.
The Single Row View for the first issue appears as shown in Figure 4-4, "Single Row View of the First Issue".
Figure 4-4 Single Row View of the First Issue
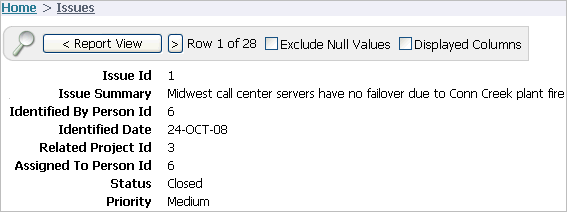
Description of "Figure 4-4 Single Row View of the First Issue"
The Create Application Wizard configured the Issues interactive report Link Column to display the Single Row View. This is the default when the wizard creates a page type of Report.
Tip:
The Link Column can be reconfigured by going to the Report Attributes page and changing the Link Column setting. See Introducing Interactive Report Components. -
Click the Application ID link on the Developer toolbar at the bottom of the page to return to the Application home page.
Notice that the Create Application Wizard also created a Login page.
Display People and Project Names
In this section, you replace columns containing person Ids and project Ids with columns containing actual name values. Because the IT_ISSUES table does not contain person names or project names, the query is modified to join with tables that have this information. After modifying the query, you run the page and use the Select Columns action to add the name value columns to the display.
Topics in this section include:
Change the Query to Retrieve Values from Other Tables
There are four columns in the Issues report that display Ids rather than person and project names. In this section, you replace three of those columns, the Issues Id column remains, with columns containing actual person and project names.
In order to accomplish this, you edit the query to include a join of the IT_PEOPLE and IT_PROJECTS tables. The following Id columns are replaced with name value columns as described here:
-
Identified By Person Idis replaced withIdentified By -
Related Project Idis replaced withProject Name -
Assigned to Person Idis replaced withAssigned To
To change the SQL query:
-
Select 2 - Issues page.
-
Under Regions, select Issues.
-
Scroll down to Source and replace Region Source with this SQL:
SELECT "IT_ISSUES"."ISSUE_SUMMARY" as "ISSUE_SUMMARY", "IT_PEOPLE"."PERSON_NAME" as "IDENTIFIED_BY", "IT_ISSUES"."IDENTIFIED_DATE" as "IDENTIFIED_DATE", "IT_PROJECTS"."PROJECT_NAME" as "PROJECT_NAME", decode("IT_PEOPLE_1"."PERSON_NAME",NULL,'Unassigned', "IT_PEOPLE_1"."PERSON_NAME") as "ASSIGNED_TO", "IT_ISSUES"."STATUS" as "STATUS", "IT_ISSUES"."PRIORITY" as "PRIORITY", "IT_ISSUES"."TARGET_RESOLUTION_DATE" as "TARGET_RESOLUTION_DATE", "IT_ISSUES"."PROGRESS" as "PROGRESS", "IT_ISSUES"."ACTUAL_RESOLUTION_DATE" as "ACTUAL_RESOLUTION_DATE", "IT_ISSUES"."ISSUE_ID" as "ISSUE_ID", "IT_ISSUES"."RELATED_PROJECT_ID" as "PROJECT_ID" FROM "IT_PEOPLE" "IT_PEOPLE_1", "IT_PROJECTS" "IT_PROJECTS", "IT_PEOPLE" "IT_PEOPLE", "IT_ISSUES" "IT_ISSUES" WHERE "IT_ISSUES"."IDENTIFIED_BY_PERSON_ID"="IT_PEOPLE"."PERSON_ID" AND "IT_ISSUES"."ASSIGNED_TO_PERSON_ID"="IT_PEOPLE_1"."PERSON_ID"(+) AND "IT_ISSUES"."RELATED_PROJECT_ID"="IT_PROJECTS"."PROJECT_ID" -
Click Apply Changes.
-
Click Apply Changes to confirm.
Add Name Value Columns to the Display
Next, run the Issues interactive report page and use the Select Columns action to include the three additional name value columns to the display.
To add columns to the display:
-
Click the Run Page 2 icon at the top right corner of the page.
-
Click the Actions menu to the right of the Go button as shown in Figure 4-5.
-
Select the Select Columns action.
Your page should look similar to Figure 4-6.
Figure 4-6 Select Columns Action Options Page
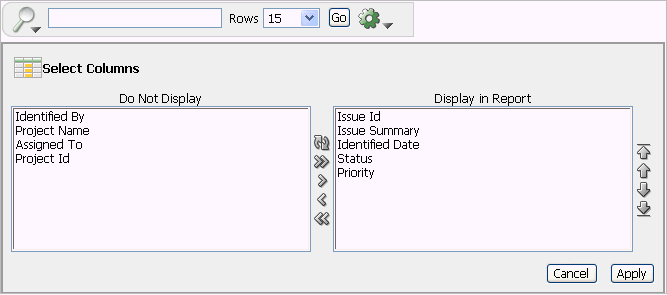
Description of "Figure 4-6 Select Columns Action Options Page"
-
Highlight Identified By in the Do Not Display box and click the Move icon (>).
-
Repeat the previous step for Project Name, and Assigned To.
The only column left in the Do Not Display box is Project Id. All other columns appear in the Display in Report list.
-
Click Apply at the bottom right of the Select Columns area.
Your Issues page should now look like Figure 4-7.
Figure 4-7 Issues Report with Person and Project Names

Description of "Figure 4-7 Issues Report with Person and Project Names"
Add a Dashboard Page
The Dashboard provides a quick snapshot of important issue tracking statistics. Regions displayed on the Dashboard include:
-
Overdue Issues Report
-
Open Issues by Project Pie Chart
Upon completion of this section, the application will have a Dashboard page similar to the one shown in Figure 4-8, "Dashboard".
Topics in this section include:
Create a Dashboard Page
First, you add a blank page to the application and name it Dashboard.
To add the Dashboard page:
-
Click the Application ID link on the Developer Toolbar.
-
Click Create Page.
-
Select Blank Page and click Next.
-
For Page Number, enter
3and click Next. -
For Create Page, make these changes:
-
Name - Enter
Dashboard. -
Title - Enter
Dashboard. -
Breadcrumb - Select Breadcrumb.
-
Entry Name - Enter
Dashboard. -
Parent Entry - Select the Home link.
-
Click Next.
-
-
For Tabs, select No and click Next.
-
Review selections and click Finish.
Add a Link on the Home Page to the Dashboard
Next, you add a link on the Home page to take users to the Dashboard. This link appears in the Navigation region on the left side of the Home page.
To add a link on the Home page to the Dashboard:
-
Navigate to the Page Definition for the Home page, page 1:
-
Click the Application home breadcrumb.
-
On the Application home page, click 1 - Home.
-
-
Under Regions, click the List link (next to Navigation).
-
On the List Entries page, click the Create List Entry button on the right side of the page.
-
On the Create/Edit List Entry page, edit the following:
-
Sequence - Enter
20. -
List Entry Label - Enter
Dashboard. -
Page - Enter
3.
-
-
Click Create.
-
Click the Application breadcrumb.
-
Click Run Application.
Notice that your Home page now includes a link to Dashboard.
-
Click Dashboard to test the link.
The blank Dashboard page appears.
Add an Overdue Issues Report Region to the Dashboard
Next, you add a report region to the Dashboard page that displays overdue issues and then add a link from the report to the Issues interactive report.
Create an Overdue Issues Report Region
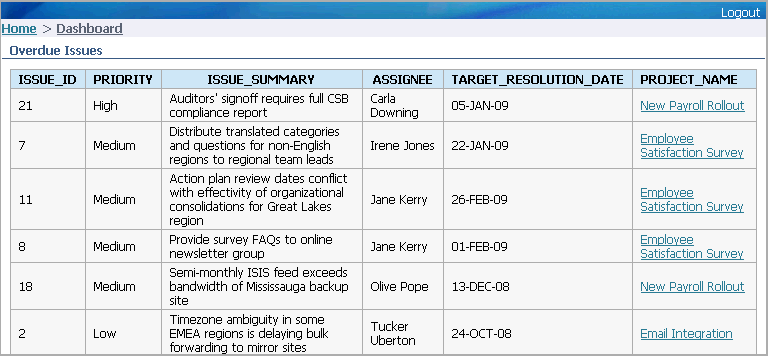
The query for this report retrieves all unclosed issues with a past target resolution date.
To add a report region:
-
Click Edit Page 3 on the Developer Toolbar.
-
Under Regions, click the Create icon.
-
Select Report and click Next.
-
For Report Implementation, select SQL Report and click Next.
-
For Display Attributes:
-
Title - Enter
Overdue Issues. -
Region Template - Select Reports Region, Alternative 1.
-
Sequence - Enter
5. -
Click Next.
-
-
For Source, enter the following in Enter SQL Query:
SELECT i.issue_id, i.priority, i.issue_summary,
    p.person_name assignee, i.target_resolution_date, r.project_name
FROM it_issues i, it_people p, it_projects r
WHERE i.assigned_to_person_id = p.person_id (+)
    AND i.related_project_id = r.project_id
    AND i.target_resolution_date < sysdate
    AND i.status != 'Closed'
The outer join is necessary because the assignment is optional.
-
Click Create Region.
Add a Link Column and Create a Declarative Filter on an Interactive Report
The following steps show you how to create a link column from the Overdue Issues Report to the Issues interactive report and how to define a declarative filter by passing filter criteria using the URL item values.
To add a link from the Project Name column to the Issues interactive report:
-
Under Regions, click the Report link.
-
Click the Edit icon to the left of PROJECT_NAME.
-
Scroll down to Column Link:
-
For Link Text, Select [PROJECT_NAME]
-
For Link Attributes, enter:
title="Click to see all issues for this project."This setting defines the item help text for the link column.
-
For Page, select 2.
-
For Clear Cache, enter:
CIR,2
This link column includes a Clear Interactive Report command,
CIR, to clear the Issues interactive report of any filters, control breaks, highlights, aggregates, computed columns, chart settings and flashback settings.The2clears the cache for the Issues report (page 2).Note:
If you want to reset the interactive report, replaceCIRwithRIR(Reset Interactive Report). TheRIRcommand resets the report to the last saved default report settings. -
For Item 1, enter the Name:
IR_PROJECT_NAME
-
For Item 1, enter the Value:
#PROJECT_NAME#
The Name and Value settings create a declarative filter for the Issues interactive report. The Project Name link passes the value of the Project Name column to the Issues report. When the link is clicked by the user, the Issues report displays all issues for that project, regardless of whether or not the issue is overdue.
-
-
Click Apply Changes.
Run the Application
To run the application:
-
Navigate to the Application home page and click the Run Application icon.
The Application home page displays.
-
Click the Dashboard link.
You should see the Dashboard page with the Overdue Issues region added as shown in Figure 4-10, "Dashboard with Overdue Issues Region Added". Notice the Project Names are displayed as links.
Figure 4-10 Dashboard with Overdue Issues Region Added
Description of "Figure 4-10 Dashboard with Overdue Issues Region Added"
-
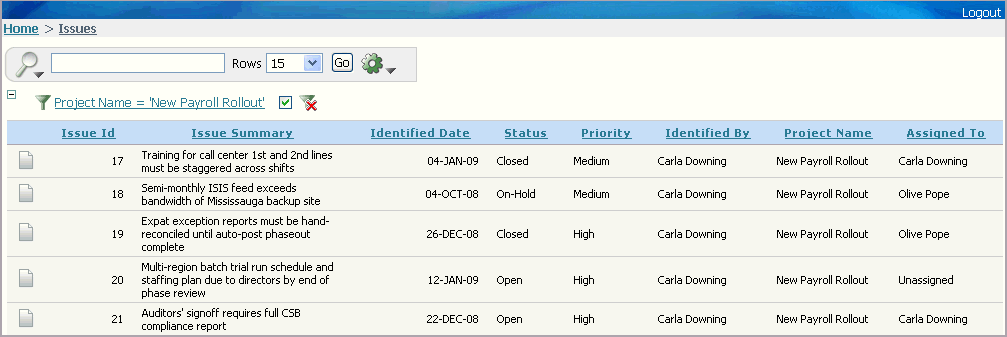
Click the New Payroll Rollout project name.
The Issues interactive report displays showing all issues categorized under the New Payroll Rollout project name.
Figure 4-11 Issues for New Payroll Rollout
Description of "Figure 4-11 Issues for New Payroll Rollout"
Notice the 'New Payroll Rollout' filter at the top of the report. The filter was created when the user clicked the Project Name link column.
Add an Open Issues by Project Pie Chart
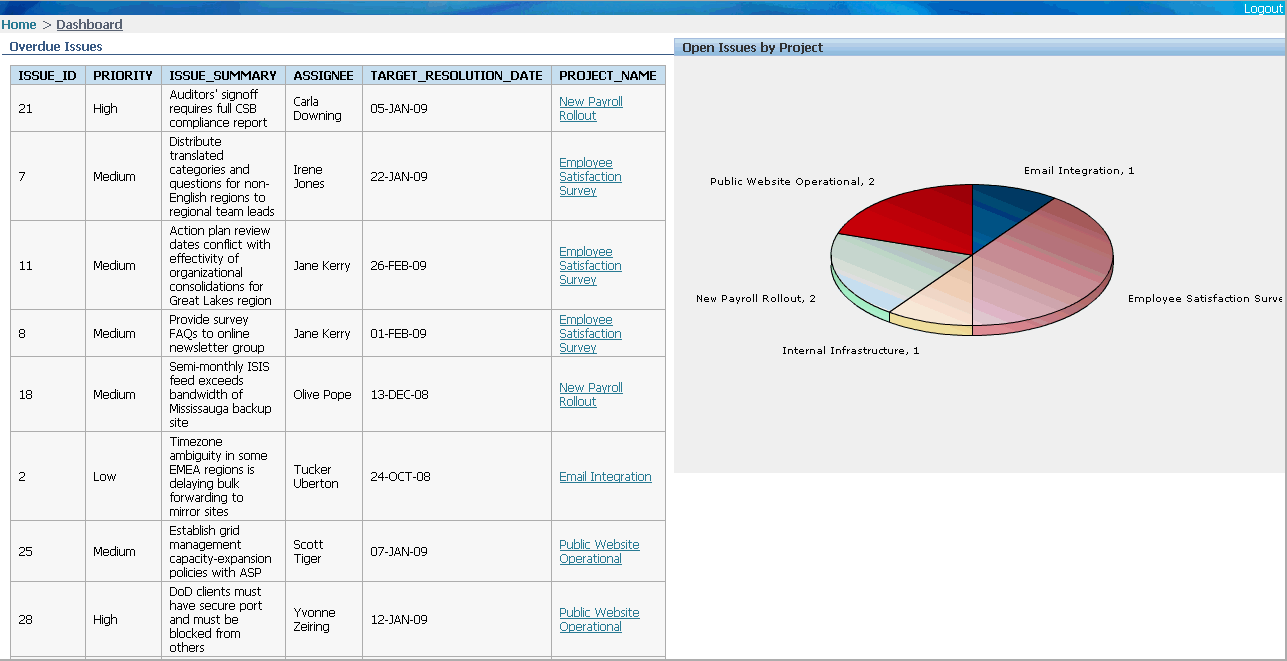
Next, add a pie chart that displays Open Issues by Project and links to the Issues report. The pie chart query gets the number of open issues for each project name from the Issues interactive report. The project names, displayed on the pie chart, link to the Issues report where all issues for the selected project appear.
Create a Pie Chart Region that Links to the Issues Report
To create a region containing a pie chart:
-
Click the Application ID link on the Developer Toolbar.
-
Click 3 - Dashboard.
-
Under Regions, click the Create icon.
-
Select Chart and click Next.
-
Select Flash Chart and click Next.
-
For Display Attributes, make these changes:
-
Title - Enter
Open Issues by Project. -
Region Template - Select Chart Region.
-
Sequence - Enter
10. -
Column - Select 2.
-
Click Next.
-
-
For Chart Preview, make these edits:
-
Chart Type - Select 3D Pie.
-
Click Next.
-
-
For Source, enter the following in SQL:
SELECT
    'f?p=&APP_ID.:2:&SESSION.:::CIR:IREQ_STATUS,IREQ_PROJECT_ID:Open,'||r.project_id LINK,
    NVL(r.project_name,'No Project') label,
    COUNT(r.project_name) value
FROM it_issues i, it_projects r
WHERE i.status = 'Open' AND i.related_project_id = r.project_id
    GROUP BY NULL, r.project_name, r.project_id
    ORDER BY r.project_name, r.project_id
Notice the
SELECTstatement is sending a request to the Issues interactive report page 2 asking for the number of issues that belong to a particular project name and that have a status ofOpen. TheCIRcommand is used to Clear the Interactive Report to make sure all of the requested values are included in the query and have not been filtered out or set as a column to not display. -
For When No Data Found Message, enter No open issues.
-
Click Create Region.
Run the Dashboard and Link to the Issues Report
Next, you run the Dashboard page to view the added pie chart region and select one of the project names to link to the Issues report.
To view the revised Dashboard page:
-
Click the Run Page 3 icon.
The Dashboard displays with the added pie chart region.
Figure 4-12 Final Dashboard with Both regions Added
Description of "Figure 4-12 Final Dashboard with Both regions Added"
-
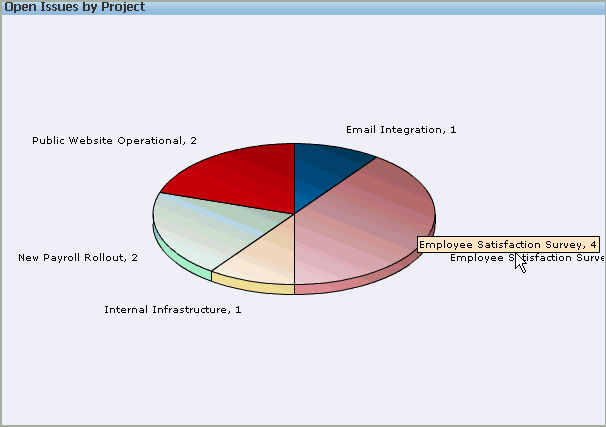
On the pie chart, locate the Employee Satisfaction Survey project link as shown in Figure 4-13.
Figure 4-13 Dashboard Open Issues by Project Pie Chart
Description of "Figure 4-13 Dashboard Open Issues by Project Pie Chart"
-
Click the Employee Satisfaction Survey project link.
The Issues report for all Employee Satisfaction Survey issues with a status of Open appears as shown in Figure 4-14.
Figure 4-14 Issues Report for Open Employee Satisfaction Survey Issues
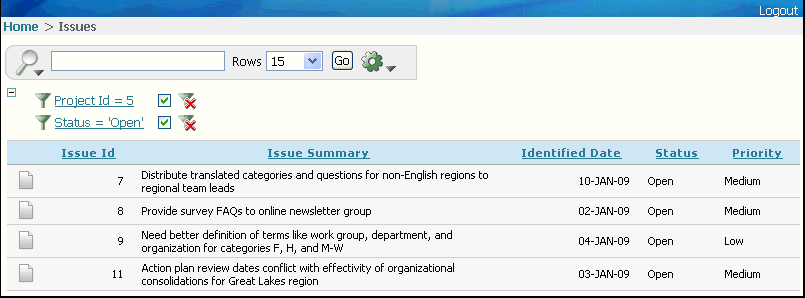
Description of "Figure 4-14 Issues Report for Open Employee Satisfaction Survey Issues"
Notice the filters in the report settings section. The Issues report has been filtered by project and by status.
Related Documentation
For additional information on this and related topics:
-
Interactive Report Online Help
-
Oracle Database Application Express Advanced Tutorials
"Using Advanced Report Techniques"
-
Oracle Database 2 Day + Application Express Developer's Guide
"Building the Application"
-
Oracle Database Application Express User's Guide
"Editing Interactive Reports"
For additional application examples, go to the Learning Library. Search for free online training content, including Oracle by Example (OBE), demos, and tutorials. To access the Oracle Learning Library, go to:
