10 Tuning SQL Statements
A SQL statement expresses the data you want Oracle Database to retrieve. For example, a SQL statement can retrieve the names of employees in a department. When Oracle Database executes the SQL statement, the query optimizer (also called the optimizer) first determines the best and most efficient way to retrieve the results.
The optimizer determines whether it is more efficient to read all data in the table, called a full table scan, or use an index. It compares the cost of all possible approaches and chooses the approach with the least cost. The access method for physically executing a SQL statement is called an execution plan, which the optimizer is responsible for generating. The determination of an execution plan is an important step in the processing of any SQL statement, and can greatly affect execution time.
The query optimizer can also help you tune SQL statements. By using SQL Tuning Advisor and SQL Access Advisor, you can run the query optimizer in advisory mode to examine a SQL statement or set of statements and determine how to improve their efficiency. SQL Tuning Advisor and SQL Access Advisor can make various recommendations, such as creating SQL profiles, restructuring SQL statements, creating additional indexes or materialized views, and refreshing optimizer statistics. Additionally, Oracle Enterprise Manager (Enterprise Manager) enables you to accept and implement many of these recommendations easily.
SQL Access Advisor is primarily responsible for making schema modification recommendations, such as adding or dropping indexes and materialized views. SQL Tuning Advisor makes other types of recommendations, such as creating SQL profiles and restructuring SQL statements. If significant performance improvements can be gained by creating a new index, then SQL Tuning Advisor may recommend it. However, such recommendations should be verified by running SQL Access Advisor using a SQL workload that contains a set of representative SQL statements.
This chapter describes how to tune SQL statements using SQL Tuning Advisor and contains the following sections:
See Also:
-
Chapter 11, "Optimizing Data Access Paths" for information about SQL Access Advisor
Tuning SQL Statements Using SQL Tuning Advisor
You can use SQL Tuning Advisor to tune one or more SQL statements. When tuning multiple statements, SQL Tuning Advisor does not recognize interdependencies between the SQL statements. Instead, SQL Tuning Advisor provides a convenient way to obtain tuning advice for a large number of SQL statements.
Oracle Database can generate SQL tuning reports automatically. Automatic SQL Tuning runs during system maintenance windows as an automated maintenance task, searching for ways to improve the execution plans of high-load SQL statements. A maintenance window is a contiguous time interval during which automated maintenance tasks are run.
Tuning SQL Manually Using SQL Tuning Advisor
As described in Chapter 9, "Identifying High-Load SQL Statements", Automatic Database Diagnostic Monitor (ADDM) automatically identifies high-load SQL statements. If ADDM identifies such statements, then click Schedule/Run SQL Tuning Advisor on the Recommendation Detail page to run SQL Tuning Advisor.
To tune SQL statements manually using SQL Tuning Advisor:
-
On the Database Home page, under Related Links, click Advisor Central.
The Advisor Central page appears.
-
Under Advisors, click SQL Advisors.
The SQL Advisors page appears.
-
Under SQL Tuning Advisor, click SQL Tuning Advisor.
The Schedule SQL Tuning Advisor page appears.
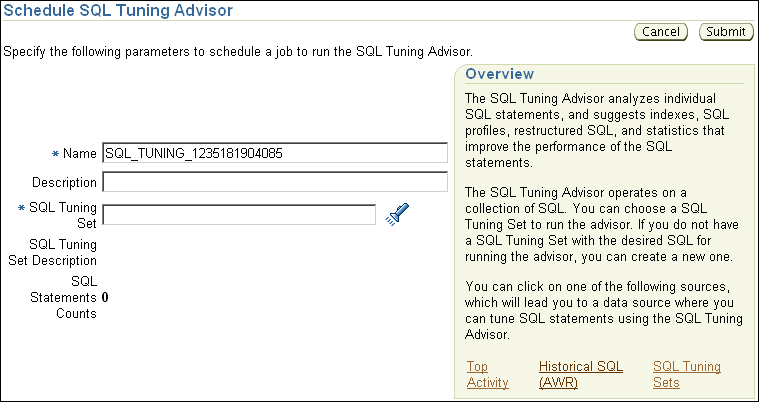
Description of the illustration sql_tuning_advisor_empty.gif
-
In the Name field, enter a name for the SQL tuning task.
If unspecified, then SQL Tuning Advisor uses a system-generated name.
-
Do one of the following:
-
To run a SQL tuning task for one or more high-load SQL statements, under SQL Tuning Advisor Data Source Links, click Top Activity.
The Top Activity page appears.
Under Top SQL, select the SQL statement you want to tune and click Schedule SQL Tuning Advisor. See "Identifying High-Load SQL Statements Using Top SQL" to learn how to identify high-load SQL statements using the Top Activity page.
-
To run a SQL tuning task for historical SQL statements from the Automatic Workload Repository (AWR), under SQL Tuning Advisor Data Source Links, click Historical SQL (AWR).
The Historical SQL (AWR) page appears.
Under Historical SQL (AWR), click the band below the chart, and select the 24-hour interval for which you want to view SQL statements that ran on the database. Under Detail for Selected 24 Hour Interval, select the SQL statement you want to tune, and click Schedule SQL Tuning Advisor.
-
To run a SQL tuning task for a SQL tuning set, click SQL Tuning Sets.
The SQL Tuning Sets page appears.
Select the SQL tuning set that contains the SQL statements you want to tune and then click Schedule SQL Tuning Advisor. See "Creating a SQL Tuning Set" to learn how to create SQL tuning sets.
The Schedule SQL Tuning Advisor page reappears.
-
-
To display the SQL text of the selected statement, expand SQL Statements.

Description of the illustration sql_tuning_sql_statements.gif
-
Under Scope, select the scope of tuning to perform. Do one of the following:
-
Select Limited.
A limited scope takes approximately 1 second to tune each SQL statement but does not recommend a SQL profile.
-
Select Comprehensive, and then set a time limit (in minutes) for each SQL statement in the Time Limit per Statement field, and a total time limit (in minutes) in the Total Time Limit field. Note that setting the time limit too small may affect the quality of the recommendations.
Comprehensive mode may take several minutes to tune a single SQL statement. This mode is both time and resource intensive because each query must be hard-parsed. Thus, you should only use comprehensive scope for high-load SQL statements that have a significant impact on the entire system.
See "Managing SQL Profiles" to learn more about SQL profiles.
-
-
Under Schedule, do one of the following:
-
Select Immediately and then click Submit to run the SQL tuning task immediately.
The Processing: SQL Tuning Advisor Task page appears.
-
Select Later to schedule a specific time in the future, and then click OK.
-
-
On the Database Home page, under Related Links, click Advisor Central.
The Advisor Central page appears.
Under Advisor Tasks, the Results sections lists the result of advisors.

Description of the illustration sta_advisor_results.gif
-
Select a result from the table and then click View Result.
The Recommendations for SQL ID page appears.

Description of the illustration rec_for_sql_id.gif
If you used a SQL tuning set, then multiple recommendations may be shown. To help you decide whether to implement a recommendation, an estimated benefit of implementing the recommendation is displayed in the Benefit (%) column. The Rationale column displays an explanation of why the recommendation is made.
Viewing Automatic SQL Tuning Results
By analyzing data in the Automatic Workload Repository (AWR), the database can identify routine maintenance tasks. The automated maintenance tasks infrastructure (known as AutoTask) schedules these tasks to run in maintenance windows.
Maintenance windows are Oracle Scheduler time intervals that belong to the window group named MAINTENANCE_WINDOW_GROUP. By default, one window is scheduled for each day of the week. You can customize attributes of these maintenance windows, including start and end times, frequency, and days of the week.
By default, AutoTask runs the following automated maintenance tasks in all maintenance windows:
-
Optimizer Statistics Collection
-
Segment Advisor
-
SQL Tuning Advisor
You can view the results of automated execution of SQL Tuning Advisor on observed high-load SQL statements.
To view automatic SQL tuning results:
-
On the Database Home page, under Related Links, click Advisor Central.
The Advisor Central page appears.
-
Under Advisors, click SQL Advisors.
The SQL Advisors page appears.
-
Under SQL Tuning Advisor, click Automatic SQL Tuning Results.
The Automatic SQL Tuning Result Summary page appears.
The top half of the page includes sections for the status and activity summary of the SQL Tuning task.
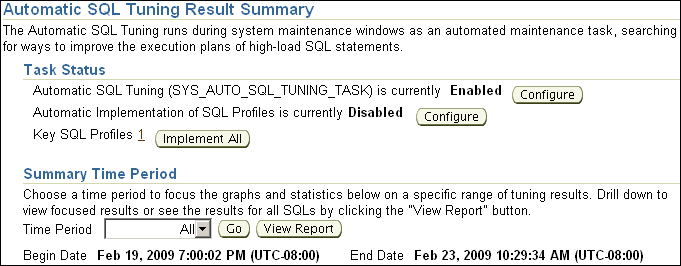
Description of the illustration sql_tuning_auto_result.gif
-
In the Time Period list, select All and then click Go.
The Overall Task Statistics and Profile Effect Statistics sections are refreshed.
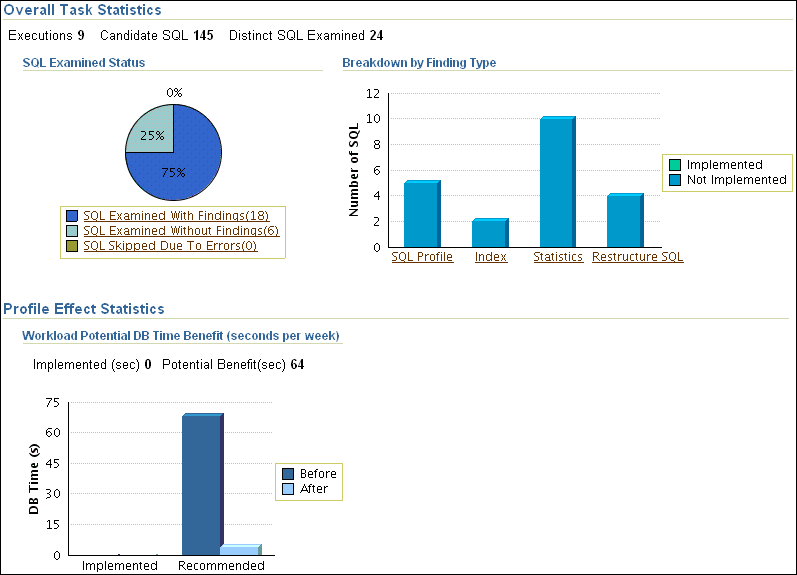
Description of the illustration sql_tuning_auto_stats.gif
-
Optionally, in the Task Status section, click Configure to change the attributes of the Automatic SQL Tuning task.
The Automated Maintenance Tasks Configuration page appears.
In this page, you can enable or disable the Automatic SQL Tuning task and specify which days it should run. Click Apply or Revert to return to the previous page.
-
In the Task Activity Summary section, leave All selected for the Time Period and then click View Report.
The Automatic SQL Tuning Result Details page appears.
The page lists SQL statements that have been automatically selected by the database as candidates for SQL tuning.
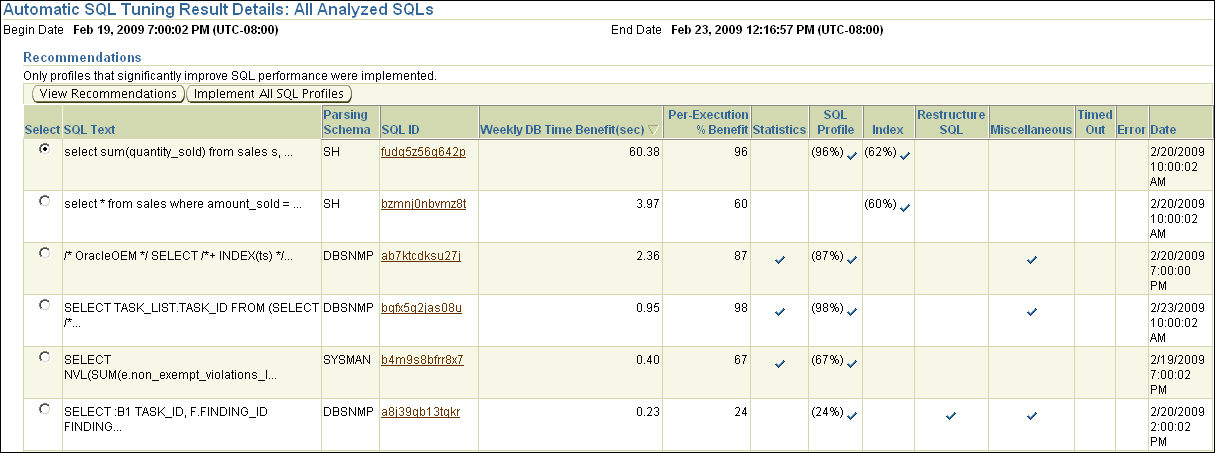
Description of the illustration sql_tuning_result_details.gif
-
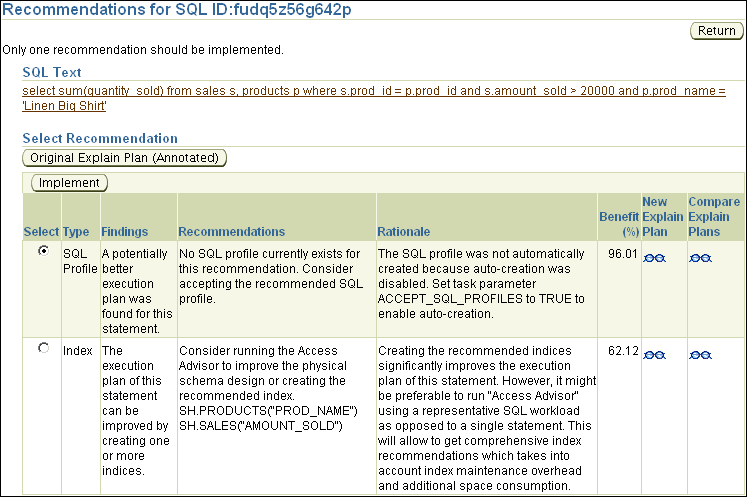
Under Recommendations, select a SQL statement and then click View Recommendations.
The Recommendations for SQL ID page appears.
Description of the illustration sql_tuning_recommend.gif
This page can include recommendations for SQL profiles and indexes. See "Tuning SQL Manually Using SQL Tuning Advisor" to learn how to implement recommendations made by SQL Tuning Advisor.
Managing SQL Tuning Sets
A SQL tuning set is a database object that includes one or more SQL statements and their execution statistics and context. You can use the set as an input for advisors such as SQL Tuning Advisor, SQL Access Advisor, and SQL Performance Analyzer. You can load SQL statements into a SQL tuning set from different SQL sources, such as AWR, the cursor cache, or high-load SQL statements that you identify.
A SQL tuning set includes the following:
-
A set of SQL statements
-
Associated execution context such as:
-
User schema
-
Application module name and action
-
List of bind values
-
Cursor compilation environment
-
-
Associated basic execution statistics such as:
-
Elapsed time and CPU time
-
Buffer gets
-
Disk reads
-
Rows processed
-
Cursor fetches
-
Number of executions and number of complete executions
-
Optimizer cost
-
Command type
-
-
Associated execution plans and row source statistics for each SQL statement (optional)
SQL statements can be filtered using the application module name and action, or any of the execution statistics. In addition, SQL statements can be ranked based on any combination of execution statistics.
SQL tuning sets are transportable, enabling SQL workloads to be transferred between databases for remote performance diagnostics and tuning. When high-load SQL statements are identified on a production system, it may not be desirable to perform investigation and tuning activities directly on this system. This feature enables you to transport the high-load SQL statements to a test system, where they can be safely analyzed and tuned. For information about transporting SQL tuning sets, see Oracle Database Performance Tuning Guide.
Using Enterprise Manager, you can manage SQL tuning sets by doing the following:
Creating a SQL Tuning Set
This section describes how to create a SQL tuning set with Enterprise Manager.
-
Specify the initial options for the SQL tuning set, as described in "Creating a SQL Tuning Set: Options".
-
Select the load method to use for collecting and loading SQL statements into the SQL tuning set, as described in "Creating a SQL Tuning Set: Load Method".
-
Specify the filter options for the SQL tuning set, as described in "Creating a SQL Tuning Set: Filter Options".
-
Schedule and submit a job to collect the SQL statements and load them into the SQL tuning set, as described in "Creating a SQL Tuning Set: Schedule".
Creating a SQL Tuning Set: Options
The first step in creating a SQL tuning set is to specify options for the set such as name, owner, and description.
To specify options for creating a SQL tuning set:
-
On the Database Performance page, under Additional Monitoring Links, click SQL Tuning Sets.
The SQL Tuning Sets page appears.
-
Click Create.
The Create SQL Tuning Set: Options page appears.
-
Enter the following details:
-
In SQL Tuning Set Name, enter a name for the SQL tuning set.
-
In Owner, enter the owner of the SQL tuning set.
-
In Description, enter a description of the SQL tuning set.
-
-
Optionally, to create an empty SQL tuning set and add SQL statements to it at a later time, complete the following steps:
-
Select Create an empty SQL tuning set.
-
Click Next.
The Create SQL Tuning Set: Review page appears.
-
Review your SQL tuning set options and click Submit.
The empty SQL tuning set is created. You can add SQL statements to it later.
-
-
Click Next.
The Create SQL Tuning Set: Load Methods page appears.

Description of the illustration sts_load_methods.gif
-
Proceed to the next step, as described in "Creating a SQL Tuning Set: Load Method".
Creating a SQL Tuning Set: Load Method
After options are specified for the SQL tuning set, select the load method to use for collecting and loading SQL statements into the SQL tuning set, as described in the following sections:
Tip:
Before selecting the load method for the SQL tuning set, create a SQL tuning set and specify the initial options, as described in "Creating a SQL Tuning Set: Options"Loading Active SQL Statements Incrementally from the Cursor Cache
You can load active SQL statements from the cursor cache into the SQL tuning set incrementally over a specified period of time. This technique enables you to not only collect current and recent SQL statements stored in the SQL cache, but also SQL statements that will run during a specified time period in the future.
To load active SQL statements incrementally from the cursor cache:
-
On the Create SQL Tuning Set: Load Methods page, select Incrementally capture active SQL statements over a period of time from the cursor cache.
-
In the Duration field, specify how long active SQL statements will be captured.
-
In the Frequency field, specify how often active SQL statements will be captured during the specified duration.
-
Click Next.
The Create SQL Tuning Set: Filter Options page appears.
-
Proceed to the next step, as described in "Creating a SQL Tuning Set: Filter Options".
Loading SQL Statements from the Cursor Cache
You can load SQL statements from the cursor cache into the SQL tuning set. However, because only current and recent SQL statements are in the SQL cache, collecting these statements only once may result in a SQL tuning set this is not representative of the entire database workload.
To load SQL statements from the cursor cache:
-
On the Create SQL Tuning Set: Load Methods page, select Load SQL statements one time only.
-
From the Data Source list, select Cursor Cache.
-
Click Next.
The Create SQL Tuning Set: Filter Options page is shown.
-
Proceed to the next step, as described in "Creating a SQL Tuning Set: Filter Options".
Loading SQL Statements from AWR Snapshots
You can load SQL statements captured in AWR snapshots. This is useful when you want to collect SQL statements for specific snapshot periods of interest that can be used for later comparison or tuning purposes.
To load SQL statements from AWR snapshots:
-
On the Create SQL Tuning Set: Load Methods page, select Load statements one time only.
-
In the Data Source list, select AWR Snapshots.
-
In the AWR Snapshots field, select the snapshots to include. Do one of the following:
-
Select either ALL or a time period such as Last 24 hours and then go to Step 5.
Only snapshots that are captured and stored in AWR in the specified time will be included.
-
Select Customize and then go to Step 4.
Only snapshots that are captured and stored in AWR during a customized time period that you specify will be included.
-
-
To select a customized time period of snapshots, complete the following steps:
-
Select Customize and then click Go.
The Select Time Period window opens.
-
For the starting snapshot, select Period Start Time and then click the snapshot icon below the Active Session graph that corresponds to the desired start time.
-
For the ending snapshot, select Period End Time and then click the snapshot icon below the Active Session graph that corresponds to the desired end time.
-
Click Select.
In this example, the snapshot taken on February 17, 2009 at 12:10 p.m. is selected as the start time, and the snapshot taken on February 17, 2009 at 1:30 p.m. is selected as the end time.

Description of the illustration sts_load_time_period.gif
-
-
The Create SQL Tuning Set: Filter Options page is shown.
-
Proceed to the next step, as described in "Creating a SQL Tuning Set: Filter Options".
Loading SQL Statements from AWR Baselines
You can load SQL statements captured in AWR baselines. This technique is useful when you want to collect SQL statements that are representative of a time period during known performance levels that can be used for later comparison or tuning purposes.
To load SQL statements from AWR baselines:
-
On the Create SQL Tuning Set: Load Methods page, select Load SQL statements one time only.
-
In the Data Source field, select AWR Baseline.
-
In the AWR Baseline field, select the baseline to include.

Description of the illustration sts_load_baseline.gif
-
Click Next.
The Create SQL Tuning Set: Filter Options page is shown.
-
Proceed to the next step, as described in "Creating a SQL Tuning Set: Filter Options".
Loading SQL Statements from a User-Defined Workload
You can load SQL statements by importing from a table or view. This technique is useful if the workload you want to analyze is not currently running on the database or captured in an existing AWR snapshot or AWR baseline.
There are no restrictions on which schema the workload resides in, the name of the table, or the number of tables that you can define. The only requirement is that the format of the table must match format of the USER_WORKLOAD table.
To load SQL statements from a user-defined workload:
-
On the Create SQL Tuning Set: Load Methods page, select Load statements one time only.
-
In the Data Source field, select User-Defined Workload.
-
In the User-Defined Workload field, select the table or view to include.

Description of the illustration sts_load_workload.gif
-
Click Next.
The Create SQL Tuning Set: Filter Options page is shown.
-
Proceed to the next step, as described in "Creating a SQL Tuning Set: Filter Options".
Creating a SQL Tuning Set: Filter Options
After the load method is selected, you can apply filters to reduce the scope of the SQL statements found in the SQL tuning set. While using filters is optional, it can be very beneficial due to the following:
-
Using filters directs the various advisors that use the SQL tuning set as a workload source, such as SQL Tuning Advisor, SQL Access Advisor, and SQL Performance Analyzer, to make recommendations based on a specific subset of SQL statements, which may lead to better recommendations.
-
Using filters removes extraneous SQL statements from the SQL tuning set, which may greatly reduce processing time when it is used as a workload source for the various advisors.
Tip:
Before you can specify the filter options for the SQL tuning set, do the following:-
Create a SQL tuning set and specify the initial options, as described in "Creating a SQL Tuning Set: Options"
-
Select the load method, as described in "Creating a SQL Tuning Set: Load Method"
To specify filter options for a SQL tuning set:
-
On the Create SQL Tuning Set: Filter Options page, specify the values of filter conditions that you want use in the search in the Value column, and an operator or a condition in the Operator column.
Only the SQL statements that meet all of the specified filter conditions will be added to the SQL tuning set. Unspecified filter values will not be included as filter conditions in the search.
By default, the following filter conditions are displayed:
-
Parsing Schema Name
-
SQL Text
-
SQL ID
-
Elapsed Time (sec)
-
-
To add filter conditions, under Filter Conditions, select the filter condition you want to add and click Add a Filter or Column.
After the desired filter conditions have been added, specify their values in the Value column, and an operator or a condition in the Operator column.
-
To remove any unused filter conditions, click the icon in the Remove column for the corresponding filter condition you want to remove.
-
Click Next.
The Create SQL Tuning Set: Schedule page appears.
-
Proceed to the next step, as described in "Creating a SQL Tuning Set: Schedule".
Creating a SQL Tuning Set: Schedule
After the filter options are specified for the SQL tuning set, you can schedule and submit a job to collect the SQL statements and load them into the SQL tuning set.
Tip:
Before you can schedule a job to create the SQL tuning set, do the following:-
Create a SQL Tuning Set and specify the initial options, as described in "Creating a SQL Tuning Set: Options".
-
Select the load method, as described in "Creating a SQL Tuning Set: Load Method".
-
Specify the filter options, as described in "Creating a SQL Tuning Set: Filter Options".
To schedule and submit a job to create a SQL tuning set:
-
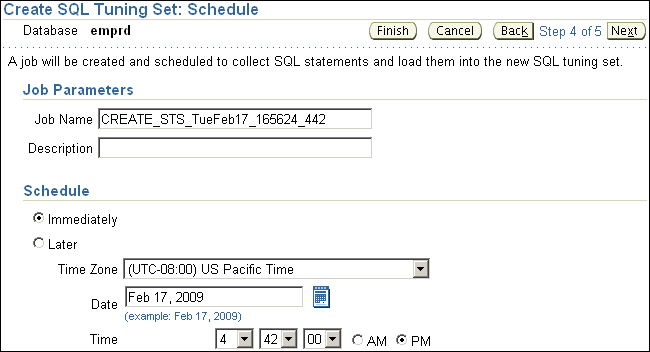
On the Create SQL Tuning Set: Schedule page, under Job Parameters, enter a name in the Job Name field if you do not want to use the system-generated job name.
-
In the Description field, enter a description of the job.
-
Under Schedule, do one of the following:
-
Immediately to run the job immediately after it has been submitted
-
Later to run the job at a later time as specified using the Time Zone, Date, and Time fields
Description of the illustration sts_schedule.gif
-
-
Click Next.
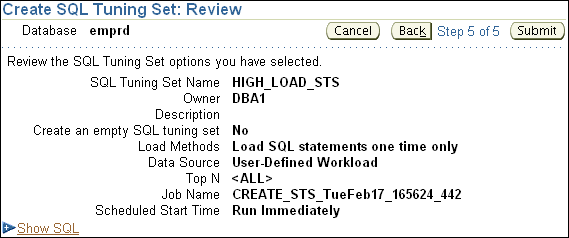
The Create SQL Tuning Set: Review page appears.
Description of the illustration sts_review.gif
-
Review the SQL Tuning Set options that you have selected.
To view the SQL statements used by the job, expand Show SQL.
-
Click Submit.
The SQL Tuning Sets page appears.
If the job was scheduled to run immediately, then a message is displayed to inform you that the job and the SQL tuning set were created successfully. If the job was scheduled to run at a later time, a message is displayed to inform you that the job was created successfully.
-
To view details about the job, such as operation status, click View Job Details.
The View Job page appears to display details about the job.
Dropping a SQL Tuning Set
This section describes how to drop a SQL tuning set. To conserve storage space, you may want to periodically drop unused SQL tuning sets stored in the database.
To drop a SQL tuning set:
-
On the Database Performance page, under Additional Monitoring Links, click SQL Tuning Sets.
The SQL Tuning Sets page appears.
Existing SQL tuning sets are displayed on this page.
-
Select the SQL tuning set you want to drop and then click Drop.
The Confirmation page appears to verify that you want to drop the selected SQL tuning set.
-
Click Yes.
The SQL Tuning Sets page appears.
A confirmation message is displayed to indicate that the SQL tuning set was successfully dropped.
Transporting SQL Tuning Sets
You can transport SQL tuning sets from one system to another by first exporting a SQL tuning set from one database, and then importing it into another database.
This section contains the following topics:
Exporting a SQL Tuning Set
This section describes how to export a SQL tuning set, enabling it to be transported to another system.
To export a SQL tuning set:
-
On the Database Performance page, under Additional Monitoring Links, click SQL Tuning Sets.
The SQL Tuning Sets page appears.
Existing SQL Tuning Sets are displayed on this page.
-
Select the SQL tuning set you want to export and then click Export.
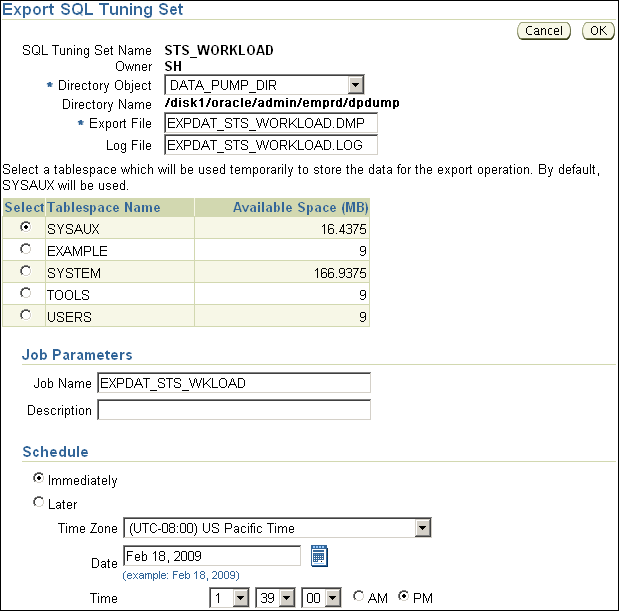
The Export SQL Tuning Set page appears.
Description of the illustration sts_export.gif
-
In the Directory Object field, select a directory where the export file will be created.
For example, to use the Oracle Data Pump directory, select
DATA_PUMP_DIR. The Directory Name field refreshes automatically to indicate the selected directory. -
In the Export File field, enter a name for the file to be database.
Alternatively, you can accept the name generated by the database.
-
In the Log File field, enter a name for the log file for the export operation.
Alternatively, you can accept the name generated by the database.
-
Select a tablespace to temporarily store the data for the export operation.
By default,
SYSAUXis used. -
Under Job Parameters, in the Job Name field, enter a name for the job.
Alternatively, you can accept the name generated by the database.
-
Under Schedule, do one of the following:
-
Select Immediately to run the job immediately after it has been submitted.
-
Select Later to run the job at a later time as specified by selecting or entering values in the Time Zone, Date, and Time fields.
-
-
Click OK.
The SQL Tuning Sets page appears.
A confirmation message indicates that the job was created successfully.
-
Transport the export file to another system using the mechanism of choice, such as Oracle Data Pump or a database link.
Importing a SQL Tuning Set
Before a SQL tuning set can be imported, you must first export a SQL tuning set from another system and transport it to your current system. For more information, see "Exporting a SQL Tuning Set".
To import a SQL tuning set:
-
On the Database Performance page, under Additional Monitoring Links, click SQL Tuning Sets.
The SQL Tuning Sets page appears.
-
Click Import.
The Import SQL Tuning Set page appears.
-
In Directory Object, select the directory containing the file to be imported.
The directory should contain the export file that was transported to your current system. For example, if the file resides in the Data Pump directory, then select
DATA_PUMP_DIR. The Directory Name field refreshes automatically to indicate the selected directory. -
In the Import File field, enter the name of the dump file that will be imported.
-
In the Log File field, enter a name for the log file for the import operation.
-
To replace an existing SQL tuning set with the one that you are importing, select Replace the existing SQL tuning set if one exists.
-
Select a tablespace to temporarily store the data for the import operation.
By default,
SYSAUXis used. -
Under Job Parameters, in the Job Name field, enter a name for the job.
Alternatively, you can accept the name generated by the system.
-
Under Schedule, do one of the following:
-
Select Immediately to run the job immediately after it has been submitted.
-
Select Later to run the job at a later time as specified by selecting or entering values in the Time Zone, Date, and Time fields.
-
-
Click OK.
The SQL Tuning Sets page appears.
A confirmation message is displayed to indicate that the job was successfully created. If the job is scheduled to run immediately, then the imported SQL tuning set will be shown on this page. You may need to refresh to see the SQL tuning set.
Managing SQL Profiles
A SQL profile is a set of auxiliary information that is built during automatic tuning of a SQL statement. A SQL profile is to a SQL statement what statistics are to a table.
When running a SQL Tuning Advisor task with a limited scope, the optimizer makes estimates about cardinality, selectivity, and cost that are sometimes significantly off, resulting in poor execution plans. To address this problem, consider running a SQL Tuning Advisor task with a comprehensive scope to collect additional information using sampling and partial execution techniques into a SQL profile. The database can use the profile to verify and, if necessary, adjust optimizer estimates.
During SQL profiling, the optimizer uses the execution history of the SQL statement to create appropriate settings for optimizer parameters. After SQL profiling completes, the optimizer uses the information in the SQL profile and regular database statistics to generate execution plans. The additional information enables the database to produce well-tuned plans for corresponding SQL statements.
After running a SQL Tuning Advisor task with a comprehensive scope, a SQL profile may be recommended. If you accept the recommendation, then the database creates the SQL profile and enables it for the SQL statement.
In some cases, you may want to disable a SQL profile. For example, you may want to test the performance of a SQL statement without using a SQL profile to determine if the SQL profile is actually beneficial. If the SQL statement is performing poorly after the SQL profile is disabled, then you should enable it again to avoid performance degradation. If the SQL statement is performing optimally after you have disabled the SQL profile, then you may want to remove the SQL profile from your database.
To enable, disable, or delete a SQL profile:
-
On the Performance page, click Top Activity.
The Top Activity page appears.
-
Under Top SQL, click the SQL ID link of the SQL statement that is using a SQL profile.
The SQL Details page appears.
-
Click the Plan Control tab.
A list of SQL profiles is displayed under SQL Profiles and Outlines.
-
Select the SQL profile you want to manage. Do one of the following:
-
To enable a SQL profile that is disabled, click Disable/Enable.
-
To disable a SQL profile that is enabled, click Disable/Enable.
-
To remove a SQL profile, click Delete.
A confirmation page appears.
-
-
Click Yes to continue, or No to cancel the action.
See Also:
Oracle Database Performance Tuning Guide to learn how to manage SQL profiles using an APIManaging SQL Execution Plans
SQL plan management is a preventative mechanism that records and evaluates execution plans of SQL statements over time. The database builds SQL plan baselines consisting of a set of efficient plans. If the same SQL statement runs repeatedly, and if the optimizer generates a new plan differing from the baseline, then the database compares the plan with the baseline and chooses the best one.
SQL plan management avoids SQL performance regression. Events such as new optimizer statistics, changes to initialization parameters, database upgrades, and so on can cause changes to execution plans. These changes can cause SQL performance regressions that are difficult and time-consuming to fix manually. SQL plan baselines preserve performance of SQL statements, regardless of changes in the database.
You can have the database capture SQL plan baselines automatically or you can load SQL execution plans manually.
To capture SQL plan baselines automatically:
-
Access the Database Home page.
See Oracle Database 2 Day DBA for more information.
-
Select Performance, then SQL, and then SQL Plan Control.
If the Database Login page appears, then log in as a user with administrator privileges. The SQL Profile subpage of the SQL Plan Control page appears.
-
Click SQL Plan Baseline.
The SQL Plan Baseline subpage appears.

Description of the illustration sql_plan_control.gif
-
Under Settings, click the link next to Capture SQL Plan Baselines.
The Initialization Parameters page appears.
-
In the Value column of the table, select TRUE and then click OK.
You are returned to the SQL Plan Baseline subpage, which now shows Capture SQL Baselines set to TRUE.
Because you configured baselines to be captured, the database automatically keeps a history of execution plans for all SQL statements executed more than once.
To load SQL execution plans manually, the Capture SQL Baselines setting must be FALSE.
To manually load SQL execution plans:
-
Access the Database Home page.
See Oracle Database 2 Day DBA for more information.
-
Select Performance, then SQL, and then SQL Plan Control.
-
Click SQL Plan Baseline.
The SQL Plan Baseline subpage appears.
-
Click Load.
The SQL Plan Control page appears.
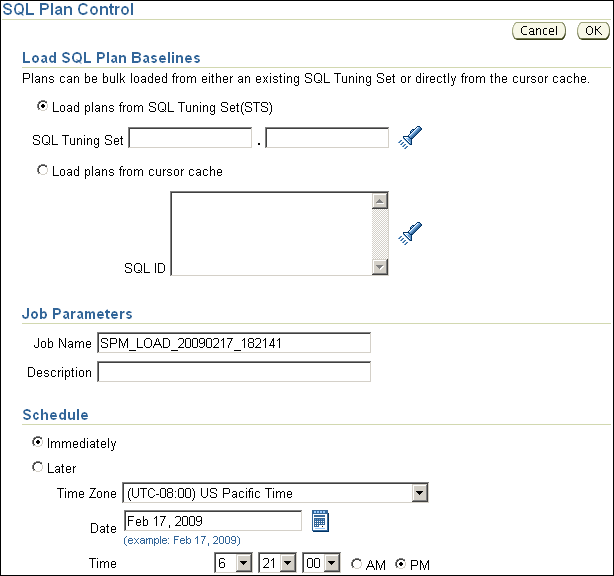
Description of the illustration sql_plan_load.gif
-
Select the SQL plan baselines to be loaded by completing the following steps:
-
Under Load SQL Plan Baselines, select Load plans from SQL Tuning Set (STS).
In this example, load plans from the SQL tuning set that you created in "Creating a SQL Tuning Set".
-
In Job Name, enter a name for the job. For example, enter
SPM_LOAD_TEST. -
Under Schedule, select Immediately.
-
Click OK.
The SQL Profile subpage of the SQL Plan Control page appears.
The table displays a list of SQL plans that are stored as SQL plan baselines.
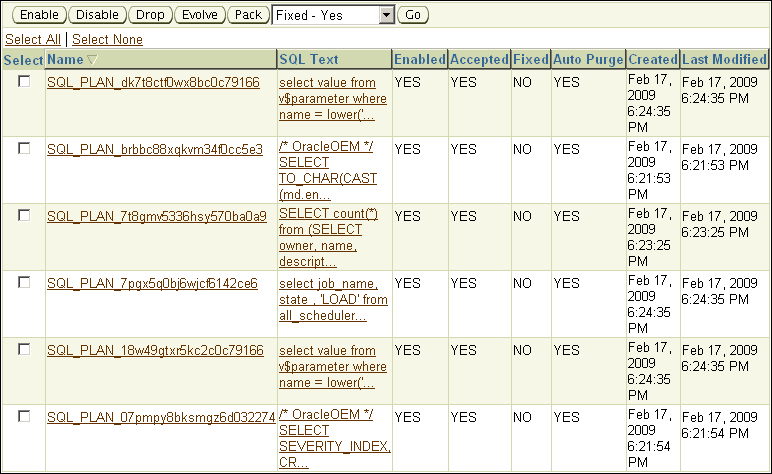
Description of the illustration sql_baselines.gif
-
-
Optionally, fix the execution plan of a baseline to prevent the database from using an alternative SQL plan baseline. Complete the following steps:
-
Select a SQL plan baseline that is not fixed.
-
Select Fixed - Yes from the list preceding the baseline table.
-
Click Go.
The table is refreshed to show the SQL execution plan with the value
YESin the Fixed column of the table. -
See Also:
-
Oracle Database Performance Tuning Guide to learn how to use SQL plan management