9 Optimizing Data Warehouse Operations
This chapter describes how to optimize your data warehouse's performance and contains the following topics:
Avoiding System Overload
This section describes how to identify and avoid system overload. In general, you should use the automatic diagnostic feature Automatic Database Diagnostic Monitor (ADDM) to identify performance problems with the database, as described in Oracle Database 2 Day + Performance Tuning Guide. This section describes additional methods for avoiding performance problems in your system and includes the following topics:
Monitoring System Performance
This section provides information about how to avoid system overload by regularly monitoring important metrics. You can monitor these metrics through the use of the Database Performance page in Oracle Enterprise Manager. This section contains the following topics:
Monitoring Parallel Execution Performance
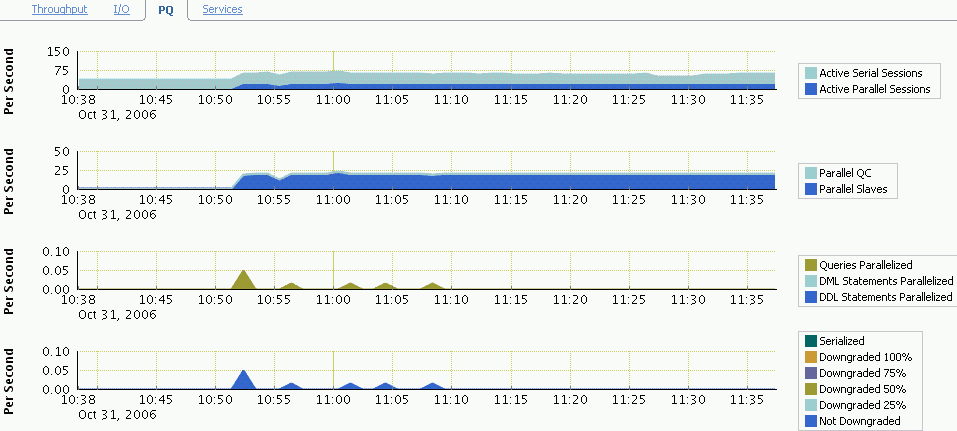
This section describes how to monitor parallel execution performance. Suppose that you see many parallel statements are being downgraded. This may indicate a performance problem. Statements that run with a degree of parallelism lower than expected can take much longer, and users may experience different execution times depending on whether or not statements were downgraded. Possible causes for downgraded parallel statements include the following:
-
The initial degree of parallelism is higher than it should be and should be lowered.
-
There are not enough parallel servers available, which may indicate the system is overloaded.
To monitor parallel execution performance:
-
On the Database Home page, click Performance.
The Performance page is displayed.
-
Scroll down the page. Under the list of links, click PQ.
The PQ page is displayed. Parallel query performance characteristics are shown for:
-
Parallel sessions
-
Parallel slaves
-
DML and DDL parallelization
-
Serialization and statement downgrades
-
Monitoring I/O
This section describes how to monitor I/O performance. If the throughput on your system is significantly lower than what you expect based on the system configuration (see Chapter 2, "Setting Up Your Data Warehouse System") and your users complain about performance issues, then there could be a performance problem. In a well-configured system that runs a typical data warehouse workload, you expect a large portion of large I/Os and a relatively low latency (lower than 30 ms) for a single block I/O.
-
On the Database Home page, click Performance.
The Performance page is displayed.
-
Scroll down the page. Under the list of links, click I/O.
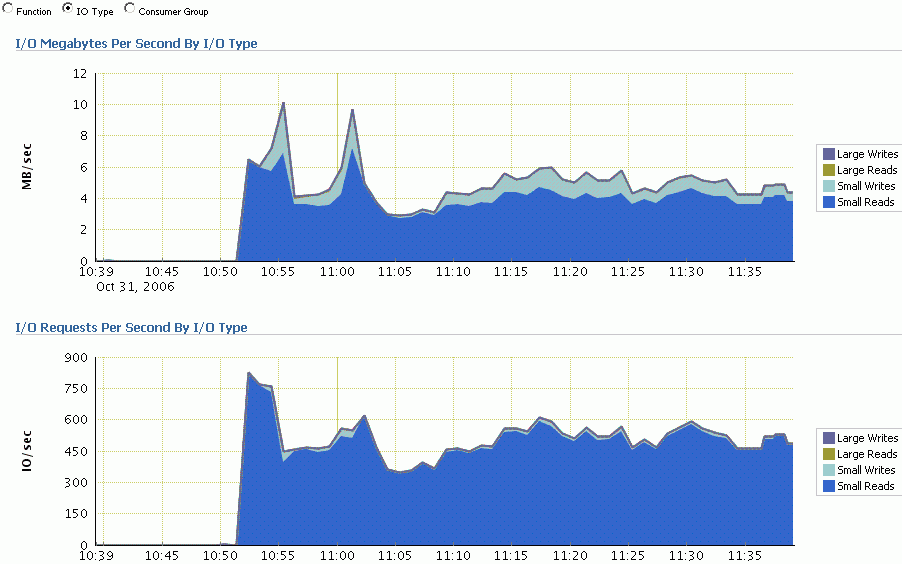
The I/O page is displayed, displaying I/O Megabytes per Second by Function and I/O Requests per Second by Function.
-
For details regarding read and write operations, select IO Type.
I/O details are shown for the following:
-
Large Writes
-
Large Reads
-
Small Writes
-
Small Reads
-
Using Database Resource Manager
The Database Resource Manager provides the ability to prioritize work within the Oracle system. Users with higher priority jobs get resources in order to minimize response time for online work, for example, while users with lower priority jobs, such as batch jobs or reports, might encounter slower response times. This priority assignment enables more granular control over resources and provides features such as automatic consumer group switching, maximum active sessions control, query execution time estimations and undo pool quotas for consumer groups.
You can specify the maximum number of concurrently active sessions for each consumer group. When this limit is reached, the Database Resource Manager queues all subsequent requests and runs them only after existing active sessions complete.
The Database Resource Manager is part of Oracle Database and can distinguish different processes inside the database. As a result, the Database Resource Manager can assign priorities to individual operations running inside the database.
With the Database Resource Manager, you can do the following:
-
Guarantee certain users a minimum amount of processing resources regardless of the load on the system and the number of users.
-
Distribute available processing resources by allocating percentages of CPU time to different users and applications. In a data warehouse, a higher percentage may be given to relational online analytical processing (ROLAP) applications than to batch jobs.
-
Enable automatic switching of users from one group to another based on administrator-defined criteria. If a member of a particular group of users creates a session that runs for longer than a specified amount of time, that session can be automatically switched to another group of users with different resource requirements.
-
Configure an instance to use a particular method of allocating resources. You can dynamically change the method, for example, from a daytime setup to a nighttime setup, without having to shut down and restart the instance.
Optimizing the Use of Indexes and Materialized Views
You can improve the performance of your data warehouse using indexes and materialized views. A key benefit of the SQL Access Advisor is its capability to use the current workload as the basis for the recommendations.
Example: Optimizing Indexes and Materialized Views Using the SQL Access Advisor
For this example, assume you have a workload running on the system that may benefit from certain indexes or materialized views.
To optimize an index and materialized view:
-
From the Advisor Central page, click SQL Advisors.
The Advisors page is displayed.
-
From the Advisors page, click SQL Access Advisor.
The SQL Access Advisor page is displayed.
-
Select Use Default Options and click Continue.
The Workload Source page is displayed.
-
Select Use an Existing SQL Tuning Set as your workload source. Go to a SQL Tuning Set and click Select. Then, click Next.
The Recommendation Options page is displayed.
-
Select Indexes, Materialized Views, and Comprehensive Mode. Click Next.
The Schedule page is displayed.
-
Click Submit.
The Recommendations page is displayed.
-
Enter a name in the Name field and select Immediately for its start time. Then, click Next.
The Review page is displayed.
-
Click Submit.
The Confirmation page is displayed.
-
Select your task name and click View Result.
You can view additional information under Recommendations, SQL Statements, or Details.
Optimizing Storage Requirements
You can reduce your storage requirements by compressing data, which is achieved by eliminating duplicate values in a database block. Database objects that can be compressed include tables and materialized views. For partitioned tables, you can compress some or all partitions. Compression attributes can be declared for a tablespace, a table, or a partition of a table. If declared at the tablespace level, then all tables created in that tablespace are compressed by default. You can alter the compression attribute for a table (or a partition or tablespace), and the change applies only to new data going into that table. As a result, a single table or partition may contain some compressed blocks and some regular blocks. This guarantees that data size will not increase as a result of compression. In cases where compression could increase the size of a block, it is not applied to that block.
Using Data Compression to Improve Storage
You can compress several partitions or a complete partitioned heap-organized table. You do this either by defining a complete partitioned table as being compressed, or by defining it on a per-partition level. Partitions without a specific declaration inherit the attribute from the table definition or, if nothing is specified on the table level, from the tablespace definition.
The decision about whether or not a partition should be compressed is based on the same rules as a nonpartitioned table. Because of the ability of range and composite partitioning to separate data logically into distinct partitions, a partitioned table is an ideal candidate for compressing parts of the data (partitions) that are mainly read-only. It is, for example, beneficial in all rolling window operations as a kind of intermediate stage before aging out old data. With data compression, you can keep more old data online, minimizing the burden of additional storage use.
You can also change any existing uncompressed table partition later, add new compressed and uncompressed partitions, or change the compression attribute as part of any partition maintenance operation that requires data movement, such as MERGE PARTITION, SPLIT PARTITION, or MOVE PARTITION. The partitions can contain data, or they can be empty.
The access and maintenance of a partially or fully compressed partitioned table are the same as for a fully uncompressed partitioned table. All rules that apply to fully uncompressed partitioned tables are also valid for partially or fully compressed partitioned tables.
The following example creates a range-partitioned table with one compressed partition costs_old. The compression attribute for the table and all other partitions is inherited from the tablespace level.
CREATE TABLE costs_demo (
   prod_id     NUMBER(6),    time_id     DATE,
   unit_cost   NUMBER(10,2), unit_price  NUMBER(10,2))
PARTITION BY RANGE (time_id)
   (PARTITION costs_old
       VALUES LESS THAN (TO_DATE('01-JAN-2003', 'DD-MON-YYYY')) COMPRESS,
    PARTITION costs_q1_2003
       VALUES LESS THAN (TO_DATE('01-APR-2003', 'DD-MON-YYYY')),
    PARTITION costs_q2_2003
       VALUES LESS THAN (TO_DATE('01-JUN-2003', 'DD-MON-YYYY')),
    PARTITION costs_recent VALUES LESS THAN (MAXVALUE));

