6 Monitoring a Database on Windows
This chapter describes how to monitor Oracle Database for Windows.
This chapter contains these topics:
Database Monitoring Overview
Table 6-1 describes tools that enable you to monitor Oracle Database.
Table 6-1 Database Monitoring Tools
| Tool | Functionality |
|---|---|
|
Oracle Counters for Windows Performance Monitor |
Monitor database objects, such as CPU usage, buffer cache, or a background process. |
|
Event Viewer |
Monitor database events. |
|
Trace Files |
Record occurrences and exceptions of database operations |
|
Alert Logs |
Record important information about error messages and exceptions during database operations. |
|
Oracle Enterprise Manager Database Management Packs |
Monitor and tune using tools with real-time graphical performance information. See Also: Your Oracle Enterprise Manager documentation set for more information |
|
Oracle Administration Assistant for Windows |
View information on or terminate any Oracle thread. |
See Also:
Oracle Database Performance Tuning Guide for general tuning informationUsing Oracle Counters for Windows Performance Monitor
Oracle Counters for Windows Performance Monitor is a graphical tool for measuring the performance of Oracle Database for Windows objects on a local server or other servers on a network. This tool is the same in appearance and operation as Windows Performance Monitor, except it has been loaded with Oracle Database performance elements.
On each computer, you can view behavior of objects, such as buffer cache, data dictionary cache, datafiles, threads, and processes. An object is a graphical representation of an element in your system. Every element, resource, and device in your system can be represented as an object.
Note:
Before using Oracle Counters for Windows Performance Monitor to view Oracle-specific counters, you must specify theSYSTEM password using operfcfg.exe or Oracle Administration Assistant for Windows. See "Using operfcfg" or "Using Oracle Administration Assistant for Windows" for instructions.A set of counters is associated with each object. A counter is a unit of measurement used by Performance Monitor to display activity. The type of activity the counter measures depends on the type of object.
Certain types of objects and their respective counters are present on all systems. Other counters, such as application-specific counters, appear only if the computer is the associated software.
Each of these objects has an associated set of counters that provide information about device usage, queue lengths, delays, and information used to measure throughput and internal congestion.
Registry Information
When you install Oracle Counters for Windows Performance Monitor, values are automatically set in the registry as described in Chapter 15, "Configuration Parameters and the Registry".
Oracle Counters for Windows Performance Monitor lets you monitor only one database instance at a time. For this reason, the registry contains the following values:
-
Hostname -
Username -
Password
Use operfcfg to change these values. Oracle recommends setting the security level on each of these registry values.
See Also:
Chapter 15, "Configuration Parameters and the Registry" for instructions on how to useoperfcfgTo use Oracle Counters for Windows Performance Monitor for another database instance on the same computer or a UNIX computer, change the values appropriately in the registry. You can also monitor non-Windows installations of Oracle Database by changing Hostname registry value so it points to another computer specified in file tnsnames.ora.
Accessing Oracle Counters for Windows Performance Monitor
To access Oracle Counters for Windows Performance Monitor:
From the Start menu, select Programs, then select Oracle - HOME_NAME, then select Configuration and Migration Tools and then select Oracle Counters for Windows Performance Monitor.
Oracle Counters for Windows Performance Monitor has four views you can choose from the View menu:
-
Chart view displays database activity as it occurs.
-
Alert view lets you know when certain minimum performance criteria are not being met, or maximum criteria are being exceeded.
-
Log view maintains continuous records on performance.
-
Report view saves information about specific criteria.
See Also:
Your operating system documentation for complete information about the four views
Modifying Views
For each view you can decide objects to monitor, what counters to use for each object, and graphical attributes of the view. When an object is chosen, it is assigned a counter, a color, and added to the status bar at the bottom of Oracle Counters for Windows Performance Monitor.
To add objects to a view:
-
Choose Add To (Chart, Alert, Log, Report) from the Edit menu. (This example uses Add to Chart, but other dialogs are similar.)
The Add to Chart dialog appears.
-
In the Computer list, select the computer to monitor.
-
In the Object list, select the object or objects to monitor, then click Add.
If no data or Oracle Database objects appear, then either Oracle Database is not or an invalid host string or password has been entered. If the database is not started, then exit Oracle Counters for Windows Performance Monitor, start the database, and restart Oracle Counters for Windows Performance Monitor.
-
In the Counter list, select one or more counters for each object you have selected. Note that the contents of the Counter list change depending upon your selection in the Object list. For details on how a counter works, highlight the counter and click Explain.
-
In the Instance list, select an instance for this counter.
-
In the Color list, choose a color for the display of the selected counter.
-
In the Scale list, choose the scale at which to display the counter.
-
In the Width list, specify the width of the line on the graph.
-
In the Style list, choose a style for your graph line.
-
Click Done when you are finished.
The selections you have chosen to monitor are displayed.
Understanding Oracle Database Performance Objects
All Oracle Database system resources that can be monitored through Oracle Counters for Windows Performance Monitor begin with 'Oracle Database'. This section lists Oracle Database objects and describes their associated counters. These measures are defined in:
ORACLE_HOME\dbs\PERFver.ora
See Also:
Oracle Database Performance Tuning Guide for additional information on these objectsNote:
You can monitor only one instance at a time using Oracle Counters for Windows Performance Monitor on a given computer.The counter is phyrds/gets %. The percentage of phyrds/gets is calculated as a Miss ratio. The lower the Miss counter, the better. To improve performance, increase the number of buffers in the buffer cache, if memory is available on the computer. This value is not time-derived.
Oracle Database Redo Log Buffer
The counter is redo log space requests. The value of this counter must be near zero. If this value increments consistently, then processes have had to wait for space in the redo log buffer. In this case, it may be necessary to increase the size of the redo log buffer.
Oracle Database Data Dictionary Cache
The counter is getmisses/gets %. The value of this counter must be less than 10 or 15% for frequently accessed data dictionary caches. If the ratio continues to increase over this threshold while your application is, then increase the amount of memory available to the data dictionary cache.
To increase the memory available to the cache, increase the value of initialization parameter SHARED_POOL_SIZE. This value is not time-derived.
See Also:
Oracle Database Performance Tuning Guide for more detailed information on tuning memory allocation in Oracle DatabaseThe counter is reloads/pins %. This is the percentage of SQL statements, PL/SQL blocks, and object definitions that required reparsing. Total Reloads must be near zero. If the ratio of Reloads to Pins is greater than 1%, then reduce the library cache misses. This value is not time-derived.
The counters are phyrds/sec and phywrts/sec. These values are time-derived. Disk contention occurs when multiple processes try to access the same disk simultaneously. Depending on results from monitoring disk activity, corrective actions could include:
-
Distributing I/O
-
Separating datafiles and redo log files
-
Separating tables and indexes
-
Striping table data
The two counters available, buffers scanned/sec and LRU scans/sec, are helpful in tuning Buffer Cache. Buffers scanned/sec is the number of buffers DBWR scanned in each second. The buffers scanned are on the LRU (Least Recently Used) list. LRU scans/sec is the number of times DBWR scanned the (Least Recently Used) buffer list in each second.
The two counters available, timeouts/sec and checkpoints/sec, are helpful in determining how much work DBWR has been requested to perform. Timeouts/sec is the number of times DBWR timed-out in each second. DBWR is on a three second timeout interval. If DBWR has not been posted within a three second interval, then it times out.
Checkpoints/sec is the number of checkpoint messages processed by database writer in each second. Whenever a checkpoint occurs, DBWR must be messaged (posted) to "write dirty buffers to disk".
Oracle Database Dynamic Space Management
The counter is recursive calls/sec. Dynamic extension causes Oracle Database to execute SQL statements in addition to those SQL statements issued by user processes. These SQL statements are called recursive calls.
If Oracle Database makes excessive recursive calls while an application is, then it may be necessary to determine the cause. Examine the recursive calls statistic through dynamic performance table V$SYSSTAT.
The counter is free list waits/requests %. Contention for free lists is reflected by contention for free data blocks in buffer cache. You can determine if contention for free lists is reducing performance by querying V$WAITSTAT.
If the number of free list waits for free blocks is greater than 1% of the total number of requests, then consider adding more free lists to reduce contention.
The available counters are sorts in memory/sec and sorts on disk/sec. The default sort area size is adequate to hold all data for most sorts. However, if your application often performs large sorts on data that does not fit into the sort area, then you may increase sort area size.
Oracle Counters for Windows Performance Monitor Troubleshooting Information
If no data or Oracle Database objects appear in the Objects list of the Add to (Chart, Alert, Log, Report) dialog, then:
-
Ensure that Oracle Database instance is up. If it is not, then exit Oracle Counters for Windows Performance Monitor, and start the database.
-
If the database instance is up but no data or Oracle Database objects appear, then check the error file for Oracle Counters for Windows Performance Monitor:
ORACLE_HOME\dbs\OPERFver.log
If the log file indicates an invalid host string or password, then check the registry for correct values for
Hostname,Password, andUsername. See "HKEY_LOCAL_MACHINE\SYSTEM\CurrentControlSet\Services" for further information about these values. -
Restart Oracle Counters for Windows Performance Monitor.
Using Event Viewer
Oracle Database for Windows problems and other significant occurrences are recorded as events in an application event log. View and manage these recorded events in Event Viewer.
To access Event Viewer:
-
From the Start menu, select Programs, then select Administrative Tools and then select Event Viewer.
The Event Viewer window appears.
-
Choose Application from the Log menu.
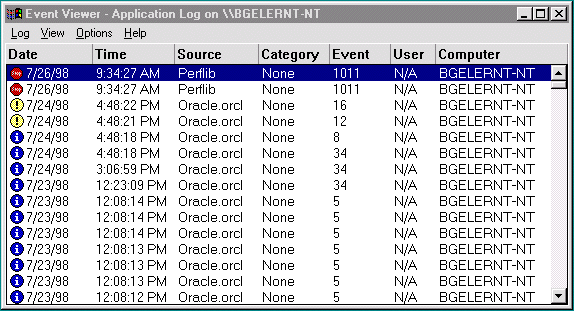
Figure 6-1 displays the Application view window, Table 6-2 shows what is recorded in each column, and Table 6-3 interprets icons that appear at the left edge of the viewer.
Table 6-2 Application View Definitions
| Column Name | Definition |
|---|---|
|
Date |
Date event took place |
|
Time |
Time event took place |
|
Source |
Application that recorded event |
|
Category |
Classification of event |
|
Event |
Unique number assigned to event |
|
Computer |
Computer name on which event occurred |
| Icon | Event Type | Suggested Action |
|---|---|---|
|
Red Stop Sign |
Error |
Always check these icons. |
|
Lower-case "i" in Blue Circle |
Information |
Noncritical system events. Check these icons only to track a specific event. |
|
Exclamation Point in Yellow Circle |
Warning |
Special events, such as instance termination or services shutdown. Investigate these icons, but they are usually noncritical. |
Reading Event Viewer
Oracle Database for Windows events display with a source of Oracle.SID.
Event number 34 specifies an audit trail event. These events are recorded if parameter AUDIT_TRAIL is set to db (true) or os in the initialization parameter file. Option os enables system wide auditing and causes audited records to be written to Event Viewer. Option db enables system wide auditing and causes audited records to be written to the database audit trail (table SYS.AUD$). Some records, however, are written to Event Viewer.
Event numbers other than 34 specify general database activities, such as an instance being started or stopped.
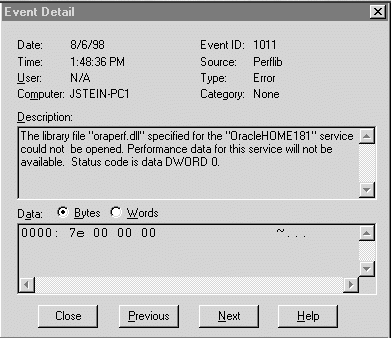
When you double-click an icon in Event Viewer, the Event Detail dialog appears with more information about the selected event. Figure 6-2, for example, shows details about EventID 1011. In the Description field you will find a text description of the event. In the Data field you can choose Bytes to see the information in hexadecimal format or Words to see DWORDS for the same data.
See Also:
Microsoft operating system documentation for more information on using Event ViewerManaging Event Viewer
Setting AUDIT_TRAIL to db or os causes more records to be written to Event Viewer. This can fill up the Event Viewer log file. Follow these procedures to increase log file size:
-
Choose Log Settings from the Log menu.
The Event Log Settings dialog appears.
-
Adjust the setting in the Maximum Log Size field to an appropriate level.
-
Click OK.
You are returned to Event Viewer.
Trace Files
Oracle Database for Windows background threads use trace files to record occurrences and exceptions of database operations, and errors. Background thread trace files are created and stored in the ADR directory specified by parameter DIAGNOSTIC_DEST in the initialization parameter file.
Oracle Database creates a different trace file for each foreground and background thread. The name of the trace file contains the name of the thread, followed by the extension ".trc". The following are examples of foreground trace file names:
-
ops_ora_5804.trc -
ops_ora_4160.trc
The following are examples of background trace file names:
-
ops_pmon_1556.trc -
ops_mmon_3768.trc -
ops_lgwr_2356.trc -
ops_dbw0_132.trc
Trace files are also created for user threads and stored in the ADR directory specified by parameter DIAGNOSTIC_DEST in the initialization parameter file. Trace files for user threads have the form oraxxxxx.trc, where xxxxx is a 5-digit number indicating the Windows thread ID.
Alert Logs
Alert logs contain important information about error messages and exceptions that occur during database operations. Each Oracle Database for Windows instance has one alert log; information is appended to the file each time you start the instance. All threads can write to the alert log.
For example, when automatic archiving of redo logs is halted because no disk space is available, a message is placed in the alert log. The alert log is the first place to check if something goes wrong with the database and the cause is not immediately obvious.
The alert log is named alert_SID.log and is found in the ADR directory specified by parameter DIAGNOSTIC_DEST in the initialization parameter file. Alert logs should be deleted or archived periodically.
See Also:
-
"ADMIN Directory" section in Oracle Database Installation Guide for Microsoft Windows
Viewing Threads
To view information on Oracle Database threads using Oracle Administration Assistant for Windows, you must either enable Windows native authentication for the database or run utility ocfgutil.exe with arguments username and password. The utility stores the user name and password in the following registry location:
HKEY_LOCAL_MACHINE\SYSTEM\CurrentControlSet\Services\OracleOraConfig
When Windows native authentication is not enabled, Oracle Remote Configuration Agent retrieves the user name and password from this registry key to log in to the database.
To view information on Oracle Database threads using Oracle Administration Assistant for Windows:
-
From the Start menu, select Programs, then select Oracle - HOME_NAME, then select Configuration and Migration Tools and then select Administration Assistant for Windows.
-
Right-click the
SID, whereSIDis a specific instance name, such asorcl. -
Choose Process Information.
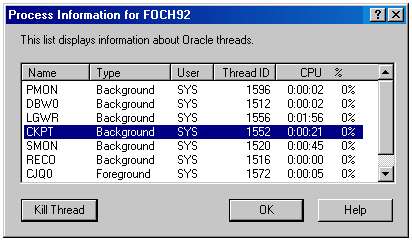
The Process Information dialog appears, listing name, type, user, thread ID, and CPU usage for each Oracle Database thread.
-
To terminate a thread, select it and click Kill Thread.

Description of the illustration procinfo.gif

