8 Monitoring Performance and Troubleshooting
Performance tuning for an Oracle Real Application Clusters (Oracle RAC) database is very similar to performance tuning for a single-instance database. Many of the tuning tasks that you perform on single-instance Oracle databases can also improve performance of your Oracle RAC database. This chapter focuses on the performance tuning and monitoring tasks that are unique to Oracle RAC.
This chapter includes the following sections:
See Also:
-
Oracle Database 2 Day DBA for more information about basic database tuning
-
Oracle Database 2 Day + Performance Tuning Guide for more information about general performance tuning
-
Oracle Real Application Clusters Administration and Deployment Guide for more information about diagnosing problems for Oracle Real Application Clusters components
-
Oracle Clusterware Administration and Deployment Guide for more information about diagnosing problems for Oracle Clusterware components
Monitoring Oracle RAC Database and Cluster Performance
Both Oracle Enterprise Manager Database Control and Oracle Enterprise Manager Grid Control are cluster-aware and provide a central console to manage your cluster database.
From the Cluster Database Home page, you can do all of the following:
-
View the overall system status, such as the number of nodes in the cluster and their current status. This high-level view capability means that you do not have to access each individual database instance for details if you just want to see inclusive, aggregated information.
-
View alert messages aggregated across all the instances with lists for the source of each alert message. An alert message is an indicator that signifies that a particular metric condition has been encountered. A metric is a unit of measurement used to report the system's conditions.
-
Review issues that are affecting the entire cluster and those that are affecting individual instances.
-
Monitor cluster cache coherency statistics to help you identify processing trends and optimize performance for your Oracle RAC environment. Cache coherency statistics measure how well the data in caches on multiple instances is synchronized. If the data caches are completely synchronized with each other, then reading a memory location from the cache on any instance returns the most recent data written to that location from any cache on any instance.
-
Determine if any of the services for the cluster database are having availability problems. A service is considered to be a problem service if it is not running on all preferred instances, if its response time thresholds are not met, and so on. Clicking on the link on the Cluster Database Home page opens the Cluster Managed Database services page where the service can be managed.
-
Review any outstanding Clusterware interconnect alerts.
Also note the following points about monitoring Oracle RAC environments:
-
Performance monitoring features, such as Automatic Workload Repository (AWR) and Statspack, are Oracle RAC-aware.
Note:
Instead of using Statspack, Oracle recommends that you use the more sophisticated management and monitoring features of the Oracle Database 11g Diagnostic and Tuning packs, which include AWR -
You can use global dynamic performance views, or GV$ views, to view statistics across instances. These views are based on the single-instance V$ views.
This section contains the following topics:
About Automatic Database Diagnostic Monitor and Oracle RAC Performance
The Automatic Database Diagnostic Monitor (ADDM) is a self-diagnostic engine built into the Oracle Database. ADDM examines and analyzes data captured in the Automatic Workload Repository (AWR) to determine possible performance problems in Oracle Database. ADDM then locates the root causes of the performance problems, provides recommendations for correcting them, and quantifies the expected benefits. ADDM analyzes the AWR data for performance problems at both the database and the instance level.
An ADDM analysis is performed as each AWR snapshot is generated, which is every hour by default. The results are saved in the database and can be viewed by using Enterprise Manager. Any time you have a performance problem, you should first review the results of the ADDM analysis. An ADDM analysis is performed from the top down, first identifying symptoms, then refining the analysis to reach the root causes, and finally providing remedies for the problems.
For the clusterwide analysis, Enterprise Manager reports two types of findings:
-
Database findings: An issue that concerns a resource that is shared by all instances in the cluster database, or an issue that affects multiple instances. An example of a database finding is I/O contention on the disk system used for shared storage.
-
Instance findings: An issue that concerns the hardware or software that is available for only one instance, or an issue that typically affects just a single instance. Examples of instance findings are high CPU load or sub-optimal memory allocation.

Description of the illustration addm_cluster_findings.gif
ADDM reports only the findings that are significant, or findings that take up a significant amount of instance or database time. Instance time is the amount of time spent using a resource due to a performance issue for a single instance and database time is the sum of time spent using a resource due to a performance issue for all instances of the database, excluding any Oracle Automatic Storage Management (Oracle ASM) instances.
An instance finding can be reported as a database finding if it relates to a significant amount of database time. For example, if one instance spends 900 minutes using the CPU, and the sum of all time spent using the CPU for the cluster database is 1040 minutes, then this finding would be reported as a database finding because it takes up a significant amount of database time.
A problem finding can be associated with a list of recommendations for reducing the impact of the performance problem. Each recommendation has a benefit that is an estimate of the portion of database time that can be saved if the recommendation is implemented. A list of recommendations can contain various alternatives for solving the same problem; you do not have to apply the recommendations.
Recommendations are composed of actions and rationales. You must apply all the actions of a recommendation to gain the estimated benefit of that recommendation. The rationales explain why the actions were recommended, and provide additional information to implement the suggested recommendation.
See Also:
-
Oracle Database 2 Day + Performance Tuning Guide for more information about configuring and using AWR and ADDM
-
Oracle Database Performance Tuning Guide for more information about Automatic Database Diagnostic Monitor
Viewing ADDM for Oracle RAC Findings
By default, ADDM runs every hour to analyze snapshots taken by the AWR during that period. If the database finds performance problems, then it displays the results of the analysis under Diagnostic Summary on the Cluster Database Home page. The ADDM Findings link shows how many ADDM findings were found in the most recent ADDM analysis.
ADDM for Oracle RAC can be accessed in Enterprise Manager by the following methods:
-
On the Cluster Database Home Page, under Diagnostic Summary, click the ADDM Findings Link.
-
On the Cluster Database Performance, click the camera icons at the bottom of the Active Sessions Graph.
-
In the Related Links section on the Cluster Database Home page or the Performance, click Advisor Central. On the Advisor Central page, select ADDM. Choose the option Run ADDM to analyze past performance and specify an appropriate time period, then click OK.
To view ADDM findings from the Cluster Database Home page:
-
On the Cluster Database Home page, under Diagnostic Summary, if a nonzero number is displayed next to ADDM Findings, then click this link.

Description of the illustration addm_diag_home.gif
You can also view the ADDM findings per instance by viewing the Instances table on the Cluster Database Home page.

Description of the illustration addm_findings_by_inst.gif
When you select the number of ADDM Findings, the Automatic Database Diagnostic Monitor (ADDM) page for the cluster database appears.
-
Review the results of the ADDM run.
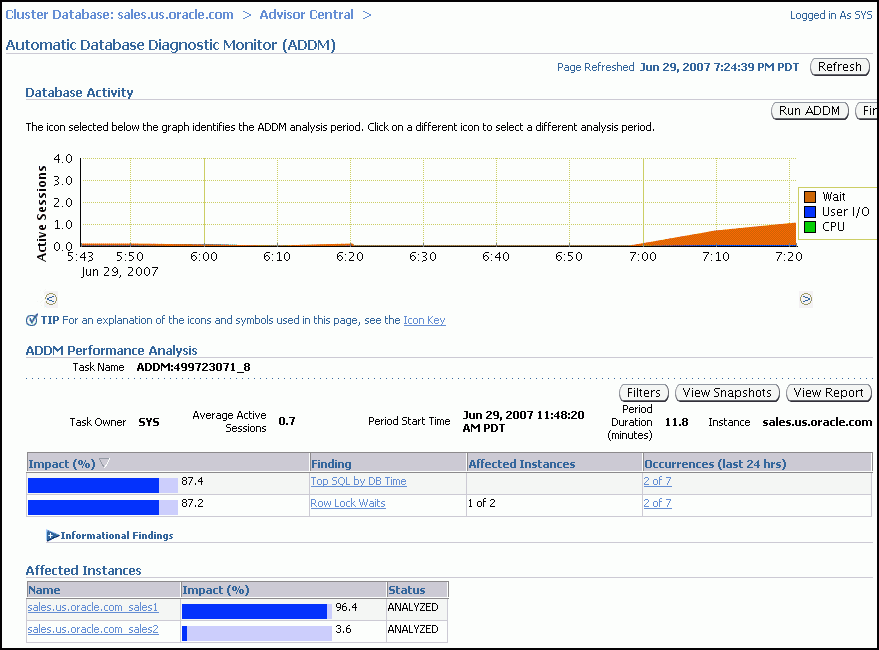
Description of the illustration addm_report_pg1.gif
On the Automatic Database Diagnostic Monitor (ADDM) page, the Database Activity chart shows the database activity during the ADDM analysis period. Database activity types are defined in the legend based on its corresponding color in the chart. Each icon below the chart represents a different ADDM task, which in turn corresponds to a pair of individual Oracle Database snapshots saved in the Workload Repository.
In the ADDM Performance Analysis section, the ADDM findings are listed in descending order, from highest impact to least impact. The Informational Findings section lists the areas that do not have a performance impact and are for informational purpose only.
The Affected Instances chart shows how much each instance is impacted by these findings.
-
(Optional) Click the Zoom icons to shorten or lengthen the analysis period displayed on the chart.
-
(Optional) To view the ADDM findings in a report, click View Report.
The View Report page appears.
You can click Save to File to save the report for later access.
-
On the ADDM page, in the Affected Instances table, click the link for the instance associated with the ADDM finding that has the largest value for Impact.
The Automatic Database Diagnostic Monitor (ADDM) page for that instance appears.
-
In the ADDM Performance Analysis section, select the name of a finding.
The Performance Findings Detail page appears.
-
View the available Recommendations for resolving the performance problem. Run the SQL Tuning Advisor to tune the SQL statements that are causing the performance findings.
See Also:
-
Oracle Database 2 Day DBA for more information about tuning a database and instance
Using the Cluster Database Performance Page
The Cluster Database Performance page provides a quick glimpse of the performance statistics for a database. Enterprise Manager accumulates data from each instance over specified periods of time, called collection-based data. Enterprise Manager also provides current data from each instance, known as real-time data.
Statistics are rolled up across all the instances in the cluster database. Using the links next to the charts, you can get more specific information and perform any of the following tasks:
-
Identify the causes of performance issues.
-
Decide whether resources need to be added or redistributed.
-
Tune your SQL plan and schema for better optimization.
-
Resolve performance issues.
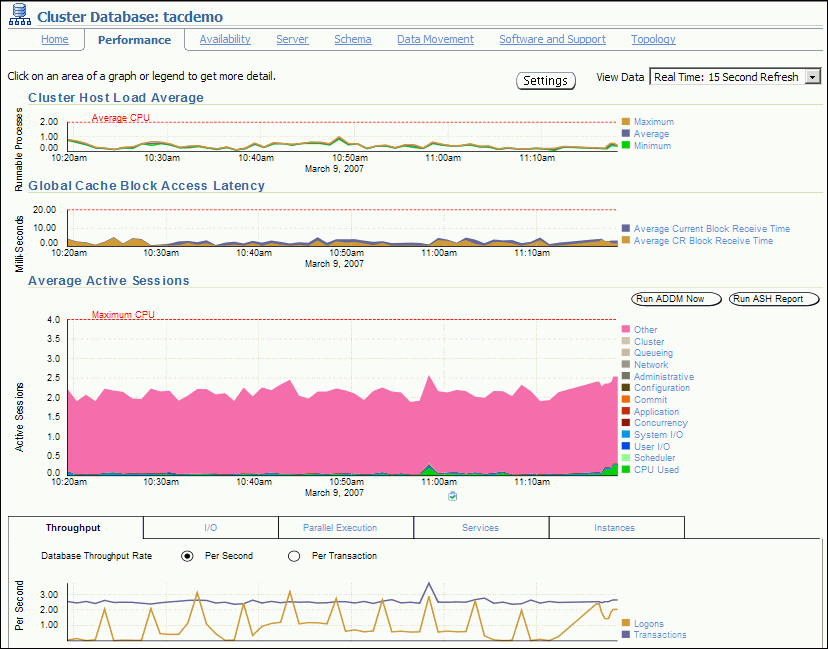
The following screenshot shows a partial view of the Cluster Database Performance page. You access this page by clicking the Performance tab from the Cluster Database Home page.
Description of the illustration cldbperf001_11g.gif
The charts on the Performance page are described in the following sections:
About Global Cache Block Access Latency Chart
Each cluster database instance has its own buffer cache in its System Global Area (SGA). Using Cache Fusion, Oracle RAC environments logically combine each instance's buffer cache to enable the database instances to process data as if the data resided on a logically combined, single cache.
When a process attempts to access a data block, it first tries to locate a copy of the data block in the local buffer cache. If a copy of the data block is not found in the local buffer cache, then a global cache operation is initiated. Before reading a data block from disk, the process attempts to find the data block in the buffer cache of another instance. If the data block is in the buffer cache of another instance, then Cache Fusion transfers a version of the data block to the local buffer cache, rather than having one database instance write the data block to disk and requiring the other instance to reread the data block from disk. For example, after the orcl1 instance loads a data block into its buffer cache, the orcl2 instance can more quickly acquire the data block from the orcl1 instance by using Cache Fusion rather than by reading the data block from disk.
The Global Cache Block Access Latency chart shows data for two different types of data block requests: current and consistent-read (CR) blocks. When you update data in the database, Oracle Database must locate the most recent version of the data block that contains the data, which is called the current block. If you perform a query, then only data committed before the query began is visible to the query. Data blocks that were changed after the start of the query are reconstructed from data in the undo segments. The reconstructed data is made available to the query in the form of a consistent-read block.
The Global Cache Block Access Latency chart on the Cluster Database Performance page shows the latency for each type of data block request, that is the elapsed time it takes to locate and transfer consistent-read and current blocks between the buffer caches.
If the Global Cache Block Access Latency chart shows high latencies (high elapsed times), then this can be caused by any of the following:
-
A high number of requests caused by SQL statements that are not tuned.
-
A large number of processes in the queue waiting for the CPU, or scheduling delays.
-
Slow, busy, or faulty interconnects. In these cases, check your network connection for dropped packets, retransmittals, or cyclic redundancy check (CRC) errors.
Concurrent read and write activity on shared data in a cluster is a frequently occurring activity. Depending on the service requirements, this activity does not usually cause performance problems. However, when global cache requests cause a performance problem, optimizing SQL plans and the schema to improve the rate at which data blocks are located in the local buffer cache, and minimizing I/O is a successful strategy for performance tuning. If the latency for consistent-read and current block requests reaches 10 milliseconds, then your first step in resolving the problem should be to go to the Cluster Cache Coherency page for more detailed information.
Viewing the Chart for Global Cache Block Access Latency
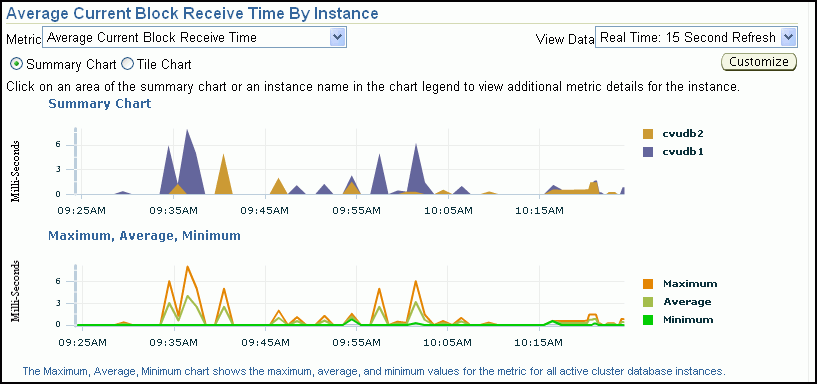
You can click either metric for the Global Cache Block Access Latency chart to view more detailed information about that type of cached block. For example, if you click the metric Average Current Block Receive Time, then the Average Current Block Receive Time by Instance page appears, displaying a summary chart that depicts the average current block receive time for up to four nodes in the cluster. You can select whether the data is displayed in a summary chart or using tile charts. If you choose Summary chart, then, by default, the instances with the four highest receive times are displayed. If you choose Tile charts, then the data for each node is displayed in its own chart. You can customize which nodes are displayed in either the Summary or Tile chart display.
Also, on the Average Current Block Receive Time By Instance page or the Cluster Cache Coherency page, you can use the slider bar on the Active Session History chart to focus on a five minute window (time period) within the past one hour. Using the slider bar enables you to identify the top sessions, services, modules, actions, or SQL statements that were running during a period of high cache coherency activity.
At the top of the page, you can use the Metric list to change the metric displayed. The choices are:
-
Average CR Block Receive Time
-
Average Current Block Receive Time
-
GC Current Blocks Received
-
GC CR Blocks Received
-
Physical Reads
-
Global Cache Block Transfers
Each metric displays a monitoring page for that metric. On each metric monitoring page you can view the data for that metric in either a summary chart or using tile charts. You can also view the Maximum, Average, Minimum chart on the metric monitoring page to view the maximum, average, and minimum values for the metric for all active cluster database instances.
Description of the illustration cldbperf004_r2.gif
Viewing the Chart for Cluster Host Load Average
The Cluster Host Load Average chart in the Cluster Database Performance page shows potential problems that are outside the database. The chart shows maximum, average, and minimum load values for available nodes in the cluster for the previous hour.
If the load average is higher than the average of the total number of CPUs across all the hosts in the cluster, then too many processes are waiting for CPU resources. SQL statements that are not tuned often cause high CPU usage. Compare the load average values with the values displayed for CPU Used in the Average Active Sessions chart. If the sessions value is low and the load average value is high, then this indicates that something else on the host, other than your database, is consuming the CPU.
You can click any of the load value labels for the Cluster Host Load Average chart to view more detailed information about that load value. For example, if you click the label Average, then the Hosts: Average Load page appears, displaying charts that depict the average host load for up to four nodes in the cluster.
You can select whether the data is displayed in a summary chart, combining the data for each node in one display, or using tile charts, where the data for each node is displayed in its own chart. You can click Customize to change the number of tile charts displayed in each row or the method of ordering the tile charts.
For more information about changing the data displayed on the Hosts: Average Load page, refer to the Enterprise Manager online Help.
Viewing the Chart for Average Active Sessions
The Average Active Sessions chart in the Cluster Database Performance page shows potential problems inside the database. Categories, called wait classes, show how much of the database is using a resource, such as CPU or disk I/O. Comparing CPU time to wait time helps to determine how much of the response time is consumed with useful work rather than waiting for resources that are potentially held by other processes.
The chart displays the workload on the database or instance and identifies performance issues. At the cluster database level, this chart shows the aggregate wait class statistics across all the instances. For a more detailed analysis, you can click the clipboard icon at the bottom of the chart to view the ADDM analysis for the database for that time period.
Compare the peaks on the Average Active Sessions chart with those on the Database Throughput charts. If the Average Active Sessions chart displays a large number of sessions waiting, indicating internal contention, but throughput is high, then the situation may be acceptable. The database is probably also performing efficiently if internal contention is low but throughput is high. However, if internal contention is high and throughput is low, then consider tuning the database.
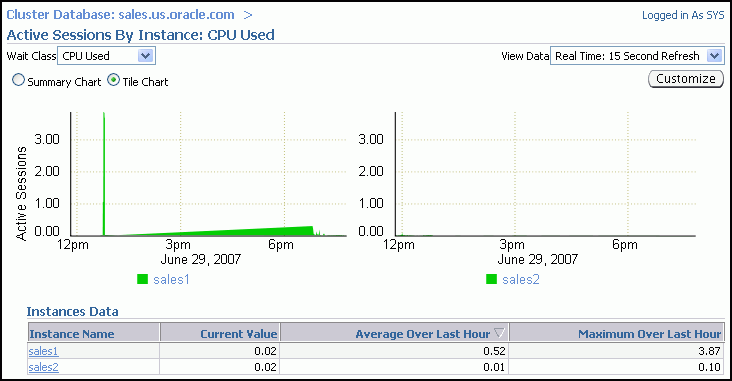
If you click the wait class legends beside the Average Active Sessions chart, then you can view instance-level information stored in Active Sessions by Instance pages. You can use the Wait Class action list on the Active Sessions by Instance page to view the different wait classes. The Active Sessions by Instance pages show the service times for up to four instances. Using the Customize button you can select the instances that are displayed. You can view the data for the instances separately using tile charts, or you can combine the data into a single summary chart.
Description of the illustration cpu_used_by_inst.gif
If you must diagnose and fix problems that are causing the higher number of wait events in a specific category, then you can select an instance of interest and view the wait events, also the SQL, sessions, services, modules, and actions that are consuming the most database resources.
See Also:
-
"About Oracle Grid Infrastructure for a Cluster and Oracle RAC"
-
Oracle Database 2 Day DBA for more information about tuning a database and instance
Viewing the Database Throughput Chart
The last chart on the Performance page monitors the usage of various database resources. By clicking the Throughput tab at the top of this chart you can view the Database Throughput chart.
The Database Throughput charts summarize any resource contention that appears in the Average Active Sessions chart, and also show how much work the database is performing on behalf of the users or applications. The Per Second view shows the number of transactions compared to the number of logons, and the amount of physical reads compared to the redo size per second. The Per Transaction view shows the amount of physical reads compared to the redo size per transaction. Logons is the number of users that are logged on to the database.
You can also obtain information at the instance level by clicking a legend to the right of the charts to access the Database Throughput by Instance page. This page shows the breakdown of the aggregated Database Throughput chart for up to four instances. Using the Customize button you can select the instances that are displayed. You can view the data for the instances separately using tile charts, or you can combine the data into a single summary chart. You can use this page to view the throughput for a particular instance, which may help you diagnose throughput problems.
You can drill down further on the Database Throughput by Instance page to see the sessions of an instance consuming the greatest resources. Click an instance name legend just under the chart to go to the Top Sessions subpage of the Top Consumers page for that instance.
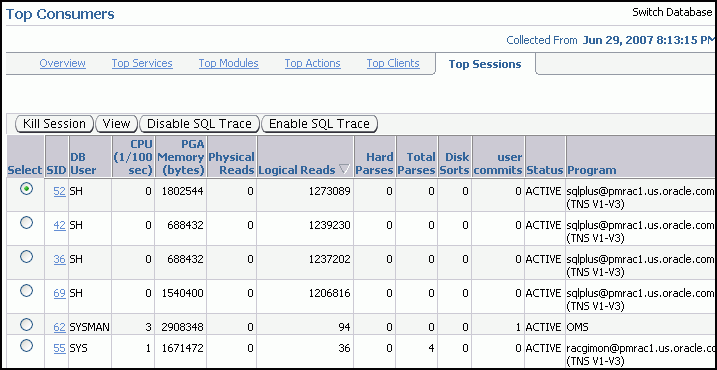
Description of the illustration top_sessions_inst.gif
For more information about the information on this page, refer to the Enterprise Manager Help system.
See Also:
-
"About Oracle Grid Infrastructure for a Cluster and Oracle RAC"
-
Oracle Database 2 Day DBA for more information about tuning a database and instance
Viewing the Services Chart
The last chart on the Performance page monitors the usage of various database resources. By clicking the Services tab at the top of this chart you can view the Services chart.
The Services charts shows the top services being used by the active sessions. Only active services are shown. You can select a service legend to the right of the chart to go to the Service subpage of the Top Consumers page. The Activity subtab is selected by default. On this page you can view real-time data showing the session loads by wait classes for the service.
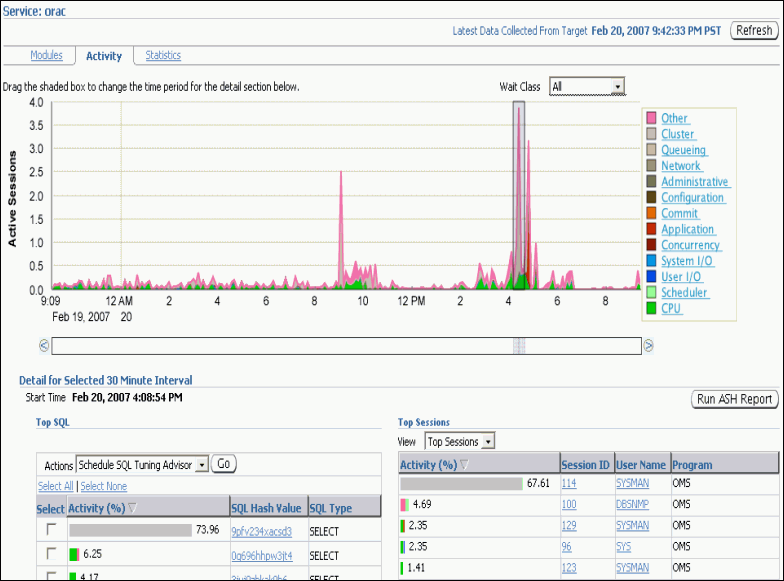
Description of the illustration addm_rac_top_service.gif
For more information about the information on this page, refer to the Enterprise Manager Help system.
Viewing the Active Sessions by Instance Chart
The last chart on the Performance page monitors the usage of various database resources. By clicking the Instances tab at the top of this chart you can view the Active Sessions by Instance chart.
The Active Sessions by Instance chart summarize any resource contention that appears in the Average Active Sessions chart. Using this chart you can quickly determine how much of the database work is being performed on each instance.
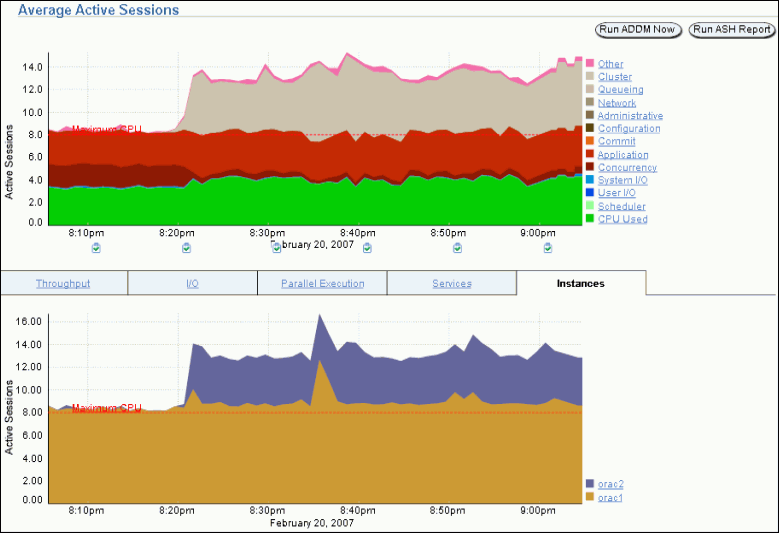
Description of the illustration addm_rac6.gif
You can also obtain information at the instance level by clicking a legend to the right of the chart to access the Top Sessions page. On the Top Session page you can view real-time data showing the sessions that consume the greatest system resources.
For more information about the information on this page, refer to the Enterprise Manager Help system.
Viewing Other Performance Related Charts
In the Additional Monitoring Links and Additional Instance Monitoring Links section of the Cluster Database Performance page, there are links to other charts that are useful in evaluating the performance of your cluster database.
This section contains the following topics:
See Also:
-
Oracle Database 2 Day DBA for more information about tuning a database and instance
Accessing the Cluster Cache Coherency Page
The Cluster Cache Coherency page contains summary charts for cache coherency metrics for the cluster.
Table 8-1 describes the Cluster Cache Coherency charts and the actions to perform to access more comprehensive information for problem resolution.
Table 8-1 Cluster Cache Coherency Charts
To access the Cluster Cache Coherency page:
-
On the Cluster Database Home page, select Performance.
The Performance subpage appears.
-
Click Cluster Cache Coherency in the Additional Monitoring Links section at the bottom of the page.
-
Alternatively, click either of the legends to the right of the Global Cache Block Access Latency chart.
The Cluster Cache Coherency page appears.
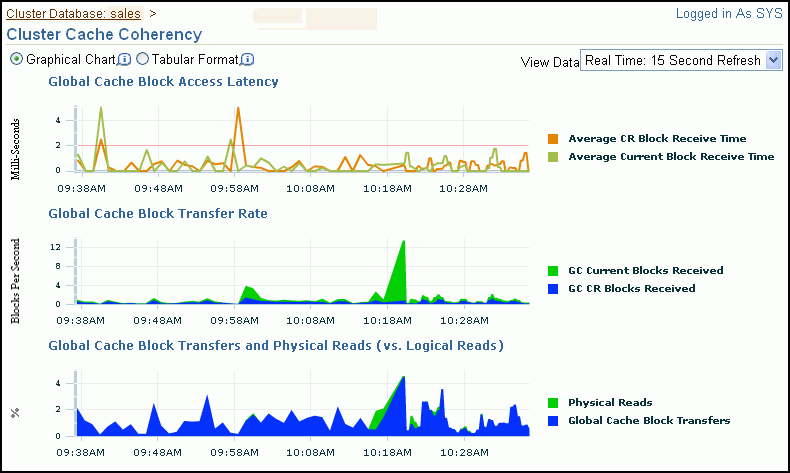
Description of the illustration cldbperf002_r2.gif
Accessing the Top Consumers Page
The Top Consumers page provides access to several tabs that enable you to view real-time or collection-based data for the services, modules, actions, clients, and sessions that are consuming the most system resources.
To access the Top Consumers page:
-
On the Cluster Database Home page, select Performance.
The Performance subpage appears.
-
Click Top Consumers in the Additional Monitoring Links section at the bottom of the page.
When accessed this way, the Top Consumers page initially displays the Overview tab by default, which shows aggregated summary data for the highest resource consumers.
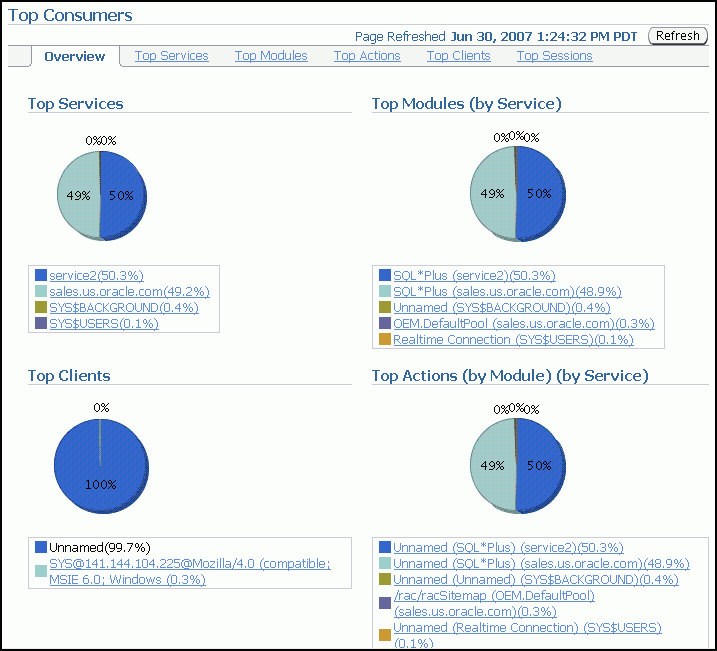
Description of the illustration top_consumers.gif
-
(Optional) Click the portion of a chart representing the consumer or click the link under the chart for that consumer to view instance-level information about that consumer.
The page that appears shows the running instances that are serving the consumer.
-
(Optional) Expand the names in the Action or Module column to show data for individual instances.
Accessing the Top Sessions Page
The Top Sessions page shows a real-time summary list of sessions based on aggregated data. You can see which sessions have consumed the greatest amount of system resources, referred to as the top sessions, and then decide whether you want to stop the sessions.
To access the Top Sessions page:
-
On the Cluster Database Home page, select Performance.
The Performance subpage appears.
-
Click Top Consumers in the Additional Monitoring Links section at the bottom of the page.
-
On the Top Consumers page, click the Top Sessions subtab.
Accessing the Top Activity Page
The Top Activity page enables you to view the cluster database activity by waits, services and instances. Also, you can see the details for the Top SQL and Top Sessions for a specific five minute interval by moving the slider bar on the Top Activity chart.
In the Top SQL detail section, you can select problematic SQL statements and either schedule the SQL Tuning Advisor for those statements or create a SQL Tuning Set.
By default, the Top Sessions for the selected time period are shown. Using the View action list in this section you can change the display to one of the following:
-
Top Sessions
-
Top Services
-
Top Modules
-
Top Actions
-
Top Clients
-
Top Files
-
Top Objects
-
Top PL/SQL
-
Top Instances
To access the Top Activity page:
-
On the Cluster Database Home page, select Performance.
The Performance subpage appears.
-
Click Top Activity in the Additional Monitoring Links section at the bottom of the page.
The Top Activity page appears.
See Also:
-
Oracle Database 2 Day DBA for more information about tuning a database and instance
Accessing the Instance Activity Page
The Instance Activity page enables you to view instance activity for several metrics within general metric categories, such as cursors, transactions, sessions, logical I/O, physical I/O, and net I/O. You can view data for each second or transaction.
To access the Instance Activity page:
-
On the Cluster Database Home page, select Performance.
The Performance subpage appears.
-
Click Instance Activity in the Additional Monitoring Links section at the bottom of the page.
-
(Optional) Click a metric legend under the chart if in Graphic mode, or click a name in the summary table if in Tabular mode to access top sessions statistics for a particular metric.
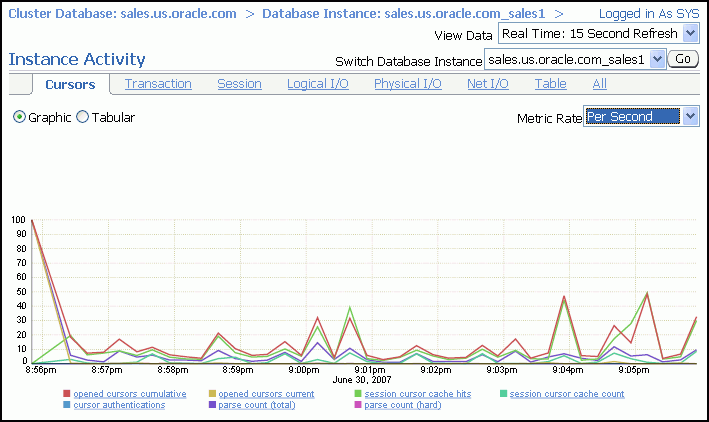
Description of the illustration instance_activity.gif
-
(Optional) Use the Switch Database Instance list to change the instance for which the data is displayed in the chart.
Accessing the Top Segments Page
Collecting and viewing statistics at the segment level is an effective method for identifying frequently accessed tables or indexes in a database. The Top Segments page enables you to gather segment-level statistics to identify performance problems associated with individual segments. This page is particularly useful for Oracle RAC, because it also tracks the number of consistent-read and current blocks received by an object. A high number of current blocks received plus a high number of buffer waits may indicate potential resource contention.
To access the Top Segments page:
-
On the Cluster Database Home page, select Performance.
The Performance subpage appears.
-
Click Top Segments in the Additional Monitoring Links section at the bottom of the page.
You can view segments for all instances, or use a filter to see segments for a specific instance.
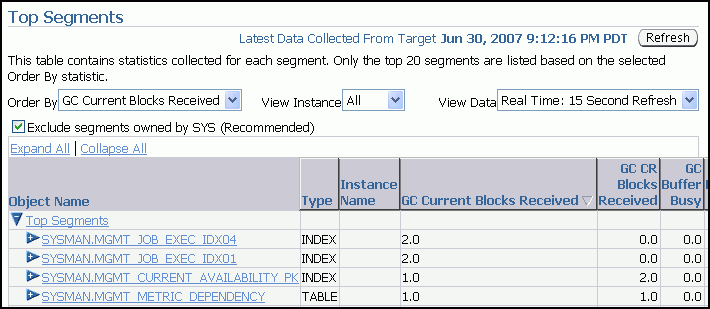
Description of the illustration top_segments.gif
Accessing the Database Locks Page
Use the Database Locks page to determine if multiple instances are holding locks for the same object. The page shows user locks, all database locks, or locks that are blocking other users or applications. You can use this information to stop a session that is unnecessarily locking an object.
To access the Database Locks page:
-
On the Cluster Database Home page, select Performance.
The Performance subpage appears.
-
Click Database Locks in the Additional Monitoring Links section at the bottom of the page.
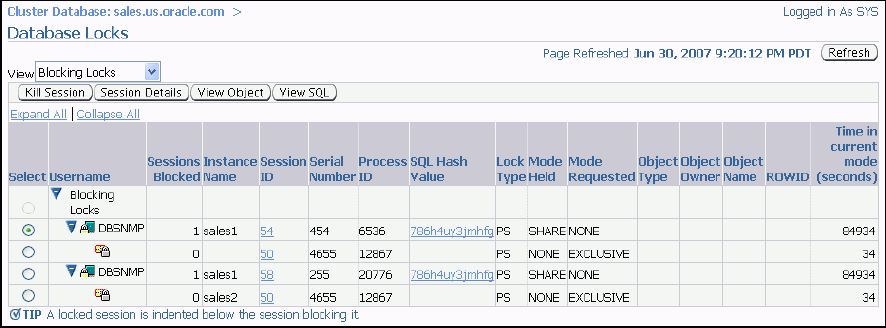
Description of the illustration database_locks.gif
Viewing the Cluster Database Topology
Using Database Control you can view a graphical representation of your cluster environment. Using the topology view you can quickly see the components that comprise your cluster database environment, such as database instances, listeners, Oracle ASM instances, hosts, and interfaces.
After you click the topology chart to activate the controls, you can mouse over a component to see the status and configuration details for that component. If you select a component in the topology chart, then you can then right-click that component to view a set of menu actions specific for that component.
To view the topology for your cluster database environment:
-
On the Cluster Database Home page, select Topology.
The Topology subpage appears.
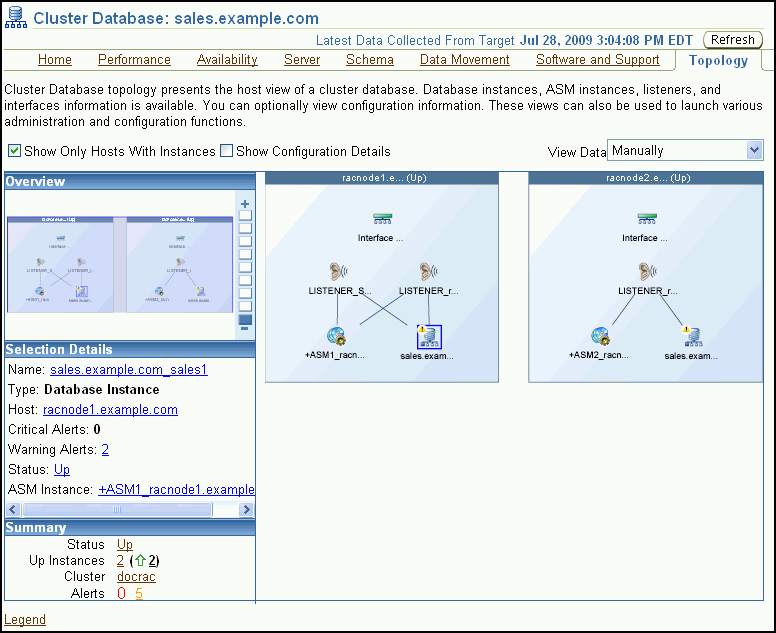
Description of the illustration topology_r2.gif
-
(Optional) Move the mouse cursor over any component in the topology diagram to display information about that component in a popup box.
-
Select any component in the topology diagram to change the information displayed in the Selection Details section.
-
(Optional) Click Legend at the bottom of the page, on the left-hand side, to display the Topology Legend page.
This page describes the icons used in Cluster Topology and Cluster Database Topology.
-
(Optional) Right-click the currently selected component to view the menu actions available for that component.
Monitoring Oracle Clusterware
You can use Enterprise Manager to monitor Oracle Clusterware. Some of the monitoring features available with Enterprise Manager include:
-
Viewing the status of Oracle Clusterware on each node of the cluster
-
Receiving notifications if there are any VIP relocations
-
Monitoring the overall throughput across the private interconnect
-
Receiving notifications if nodeapps go down or come up
-
Viewing alerts if a database instance is using the public interface instead of the VIP
-
Monitoring the Clusterware alert log for OCR or voting disk related issues, node evictions, and other clusterware errors
With Oracle Database 11g release 2 you can also monitor Oracle Clusterware resources and use cluster component health monitoring for individual components. To monitor resources you click the Administration link from the Cluster home page. To monitor the health of individual cluster components you click the All Metrics link in the Related Links section of the Cluster home page.
This section contains the following topics:
See Also:
Accessing the Oracle Clusterware Information
From the Cluster Database Home page, there a several ways to access Oracle Clusterware information.
To access Oracle Clusterware information:
-
From the Cluster Database Home page, in the General section, click the link next to Cluster to view the Cluster Home page.
Click the Database tab to return to the Cluster Database Home page.
-
Under Diagnostic Summary, click the number next to Interconnect Alerts to view the Interconnects subpage for the cluster.
Click the Database tab to return to the Cluster Database Home page.
-
In the High Availability section, click the number next to Problem Services to display the Cluster Home page.
Click the Database tab to return to the Cluster Database Home page.
-
Select Topology. Click a node in the graphical display to activate the controls. Click the Interface component. Right-click the Interface component, then choose View Details from the menu to display the Interconnects subpage for the cluster.
Reviewing the Oracle Clusterware Home Page
The Cluster Home page enables you to monitor the health and workload of your cluster. It provides a central place for general cluster state information and is updated periodically.
The various sections of the Cluster Home page provide information about the cluster environment and status of the hosts, targets, and clusterware components. For example, the Alerts and Diagnostic Summary sections warn you of errors and performance problems that are impacting the operation of your cluster. You can click the provided links to see more detail about the problem areas.
To monitor the general state of the cluster:
-
From the Cluster Database Home page, in the General section, click the link next to Cluster.
The Cluster Home page appears.
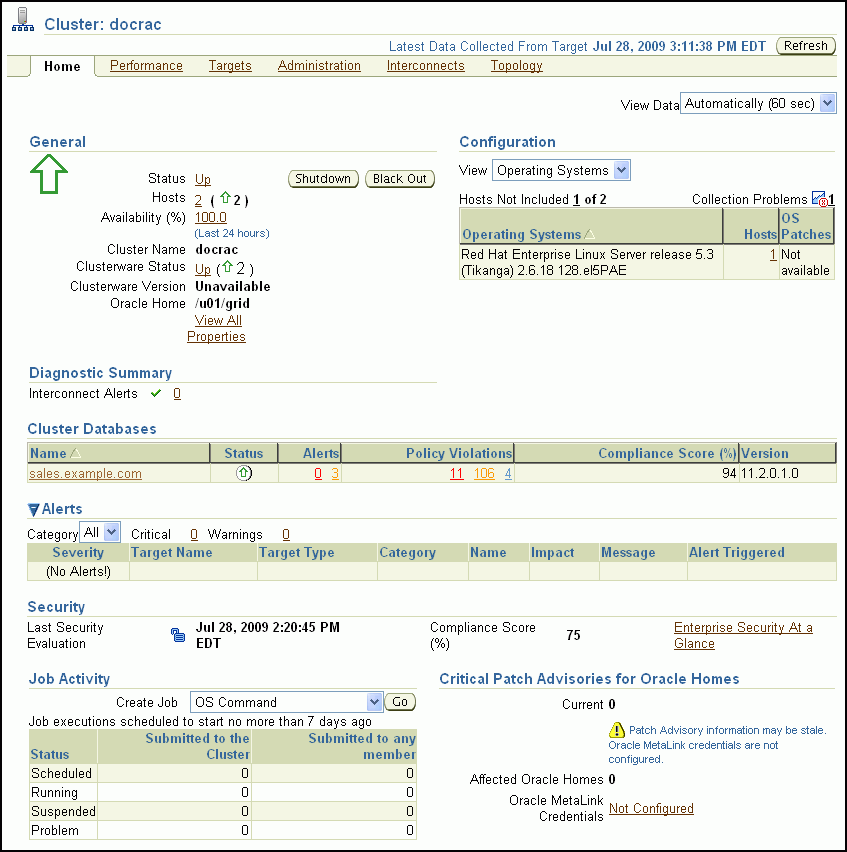
Description of the illustration cluster_home_page_r2.gif
-
(Optional) Click the Refresh button to update the information displayed.
The date and time that data was last collected from the cluster is displayed to the left of the Refresh button.
-
Get a quick view of the cluster in the General section, which includes the following information:
-
Status of the cluster, Up or Down
Click the Status link to drill down to cluster availability details.
-
Number of hosts in the cluster
-
Cluster name
-
The status of Oracle Clusterware overall and by host
-
Oracle Clusterware version
-
Oracle Clusterware home directory.
-
-
In the Configuration section, use the View list to select which of the following information is displayed for the available hosts in the cluster:
-
Operating Systems (including Hosts and OS Patches)
-
Hardware (including hardware configuration and hosts)
Click the links under Host or OS Patches for detailed information.
-
-
View the Diagnostic Summary section which contains the number of active Interconnect alerts. Click the number of alerts to view the Interconnects subpage.
-
Investigate the Cluster Databases table to view the cluster databases associated with this cluster, their availability, any alerts or policy violations on those databases, their security compliance score, and the database software version.
-
View the Alerts section, which includes the following items:
-
Category list
Optionally choose a category from the list to view only alerts in that category
-
Critical
This is the number of metrics that have crossed critical thresholds plus the number of other critical alerts, such as those caused by incidents (critical errors).
-
Warning
This is the number of metrics that have crossed warning thresholds
-
Alerts table
The Alerts table provides information about any alerts that have been issued along with the severity rating of each. Click the alert message in the Message column for more information about the alert.
When an alert is triggered, the name of the metric for which the alert was triggered is displayed in the Name column. The severity icon for the alert (Warning or Critical) is displayed, along with the time the alert was triggered, the value of the alert, and the time the metric's value was last checked.
-
-
View the date of the Last Security Evaluation and the Compliance score for the cluster in the Security section.
The compliance score is a value between 0 and 100 where 100 is a state of complete compliance to the security policies. The compliance score calculation for each target and policy combination to a great extent is influenced by the severity of the violation and importance of the policy, and to a lesser extent by the percentage of violating rows over the total number of rows tested.
-
Review the status of any jobs submitted to the cluster within the last seven days in the Job Activity section.
-
Determine if there are patches to be applied to Oracle Clusterware by reviewing the Critical Patch Advisories for Oracle Homes section.
To view available patches, you must have first configured your My Oracle Support (formerly OracleMetaLink) Credentials as discussed in "Verifying My Oracle Support Credentials".
-
View basic performance statistics for each host in the cluster in the Hosts table at the bottom of the page.
Click any link in this table to view further details about that statistic.
-
Use the subtabs at the top of the page to view detailed information for Performance, Targets, Interconnects, or Topology.
Viewing the Cluster Performance Page
The Cluster Performance page displays utilization statistics, such as CPU, Memory, and Disk I/O, during the past hour for all hosts of a cluster, which is part of the greater Enterprise Manager environment. With this information, you can determine whether you need to add or redistribute resources.
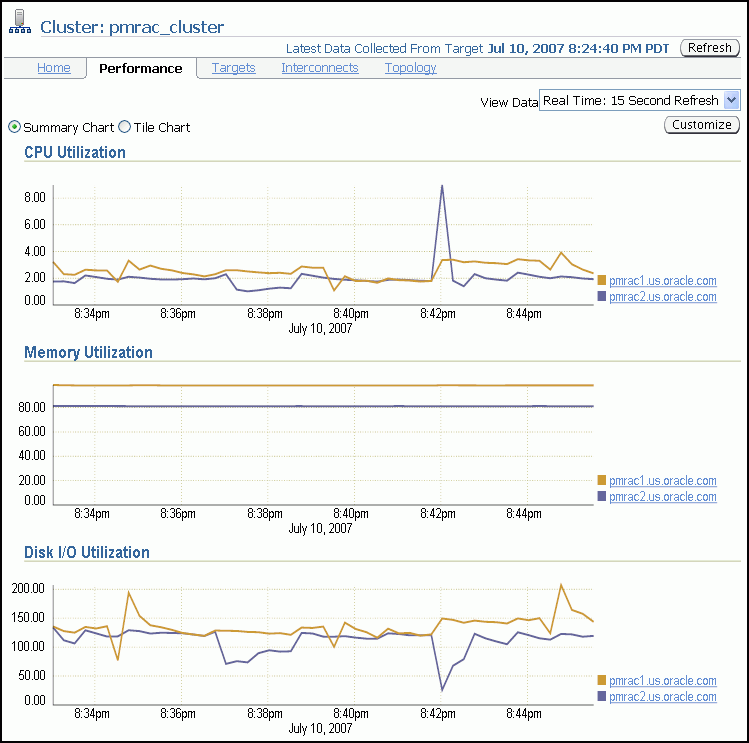
Description of the illustration cluster_perf.gif
Using the charts on the Cluster Performance page, you can:
-
View the CPU, Memory, and Disk I/O charts for the cluster across all hosts.
-
View the CPU, Memory, and Disk I/O charts for each host individually by clicking the host name in the legend to the right of the chart.
The Cluster Performance page also contains a Hosts table. The Hosts table displays summary information for the hosts for the cluster, their availability, any alerts on those hosts, CPU and memory utilization percentage, and total I/O per second. You can click a host name in the Hosts table to go to the performance page for that host.

Description of the illustration cluster_hosts_table_r2.gif
Viewing the Cluster Targets Page
The Cluster Targets page provides a complete list of all targets on the cluster. The table includes the target name, type, host, and location, also the target's availability, warning and critical alerts, and last load time.
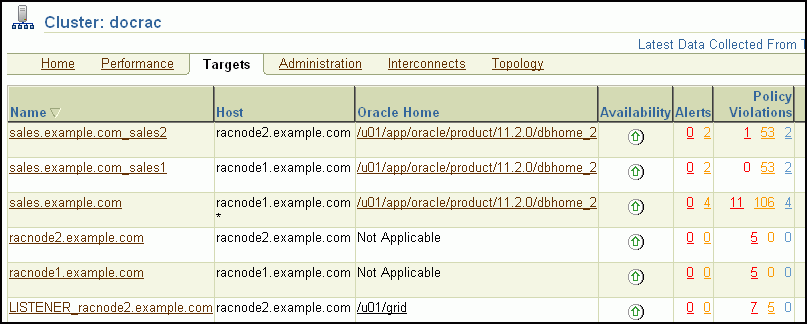
Description of the illustration cluster_targets2_r2.gif
Click a target name to go to the home page for that target. Click the links in the table to get more information about that particular item, alert, or metric.
The Hosts table displays the hosts for the cluster, their availability, any alerts on those hosts, CPU and memory utilization percentage, and total I/O per second.
See Also:
"Viewing the Cluster Database Topology"Viewing the Cluster Administration Page
Caution:
By default, any named user may create a server pool. To restrict the operating system users that have this privilege, Oracle strongly recommends that you add specific users to the CRS Administrators list. See Oracle Clusterware Administration and Deployment Guide for more information about adding users to the CRS Administrators list.On the Cluster Administration page you can manage Oracle Clusterware resources, create and manage server pools. You can also use this page to configure Oracle Database Quality of Service Management. This functionality is available starting with Oracle Database 11g Release 2 (11.2.0.2)

Description of the illustration cluster_admin_r2.gif
If you click Manage Resources, then you go to the Resources page where you can start, stop, or relocate the resources that are registered with Oracle Clusterware.
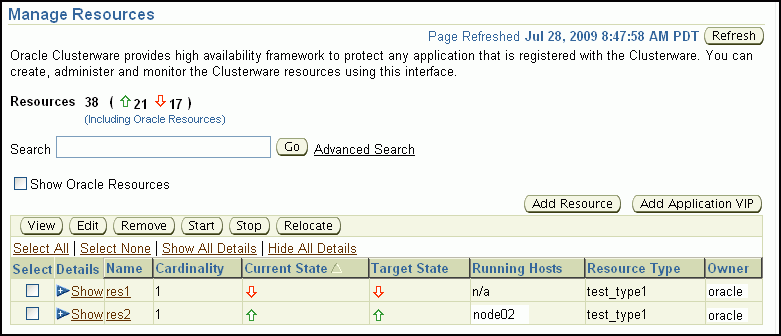
Description of the illustration cluster_admin_res_r2.gif
About the Cluster Interconnects Page
The Cluster Interconnects page is useful for monitoring the interconnect interfaces, determining configuration issues, and identifying transfer rate-related issues, including excess traffic. This page helps determine the load added by individual instances and databases on the interconnect. Sometimes you can immediately identify interconnect delays that are due to applications outside Oracle.
You can use this page to perform the following tasks:
-
View all interfaces that are configured across the cluster.
-
View statistics for the interfaces, such as absolute transfer rates and errors.
-
Determine the type of interfaces, such as private or public.
-
Determine whether the instance is using a public or private network.
-
Determine which database instance is currently using which interface.
-
Determine how much the instance is contributing to the transfer rate on the interface.
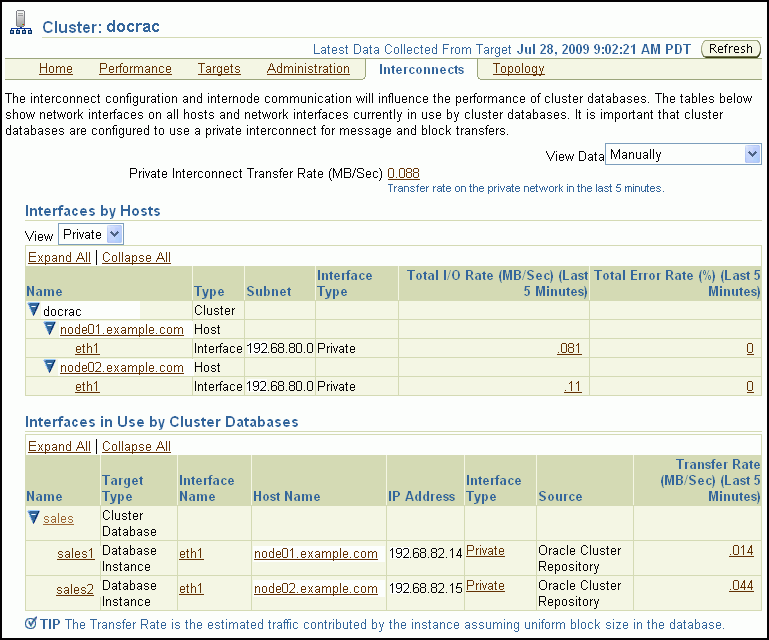
Description of the illustration cluster_interconnects_r2.gif
The Private Interconnect Transfer Rate value shows a global view of the private interconnect traffic, which is the estimated traffic on all the private networks in the cluster. The traffic is calculated as the summary of the input rate of all private interfaces known to the cluster. For example, if the traffic rate is high, then the values in the Total I/O Rate column in the Interfaces by Hosts table for private interfaces are also high. If the values in this column are high, then you should determine the cause of the high network usage. You can click a number to access the Network Interface Total I/O Rate page for historic statistics and metric values.
Using the Interfaces by Hosts table, you can drill down to the following pages:
-
Host Home
-
Hardware Details
-
Network Interface Total I/O Rate
-
Network Interface Total Error Rate
Using the Interfaces in Use by Cluster Databases table, you can view the Total Transfer Rate. This value shows the network traffic generated by individual instances for the interfaces they are using as interconnects. The values indicate how frequently the instances are communicating with other instances.
Viewing the Cluster Topology Page
The Oracle Enterprise Manager Topology Viewer enables you to visually see the relationships between target types in your cluster. You can zoom in or out, pan, and see selection details. Individually distinct icons are used to represent system target types, and standardized visual indicators, such as frames around selections, are used across all target types.
The Topology Viewer populates icons based on your system configuration. If a listener is serving an instance, then a line connects the listener icon and the instance icon. If a cluster database is configured to use Oracle ASM, then the relationship between the cluster Oracle ASM and cluster database appears in the topology.
If the Show Configuration Details option is unchecked, then the topology shows the monitoring view of the environment, which includes general information such as alerts and overall status. If you select the Show Configuration Details option, then additional details are shown in the Selection Details page, which are valid for any topology view. For instance, the listener component would also show the computer name and port number.
You can click an icon and then the right mouse button to display a menu of available actions. Several actions go to pages related to the target type where you can perform monitoring or tuning tasks.
Refer to the Enterprise Manager Online Help for more information about the contents of this page.
See Also:
"Viewing the Cluster Database Topology"Troubleshooting Configuration Problems in Oracle RAC Environments
Problems can occur when attempting to complete the installation or database creation process manually instead of using the Oracle Database management tools. Other problems occur due to the database administrator or system administrator missing important operating system or cluster configuration steps before installation. Both Oracle Clusterware and Oracle Database components have subcomponents that you can troubleshoot. The Cluster Ready Services Control (CRSCTL) command check enables you to determine the status of several Oracle Clusterware components simultaneously.
This section contains the following topics:
See Also:
Using CRSCTL to Diagnose Cluster Issues
You can use CRSCTL commands as the root operating system user to diagnose problems with your Oracle Clusterware installation, or to enable dynamic debugging for Oracle Clusterware. This section contains the following topics:
See Also:
About the Oracle Clusterware Alert Log
Oracle Clusterware posts alert messages when important events occur. For example, you might see alert messages from the Cluster Ready Services (CRS) daemon process when it starts, if it aborts, if the failover process fails, or if automatic restart of an Oracle Clusterware resource failed.
Enterprise Manager monitors the Clusterware log file and posts an alert on the Cluster Home page if an error is detected. For example, if a voting disk is not available, then a CRS-1604 error is raised, and a critical alert is posted on the Cluster Home page. You can customize the error detection and alert settings on the Metric and Policy Settings page.
The Oracle Clusterware should be the first place to look for serious errors. It often contains references to other diagnostic logs that provide detailed information on a specific component. The location of the Oracle Clusterware log file is CRS_home/log/hostname/alerthostname.log, where CRS_home is the directory in which Oracle Clusterware was installed and hostname is the host name of the local node.
About the Oracle Clusterware Component Log Files
Oracle RAC uses a unified log directory structure to store all the Oracle Clusterware component log files. This consolidated structure simplifies diagnostic information collection and assists during data retrieval and problem analysis.
In each of the following log file locations, hostname is the name of the node, for example, racnode2 and CRS_home is the directory in which the Oracle Clusterware software was installed.
The log files for the CRS daemon, crsd, can be found in the following directory:
CRS_home/log/hostname/crsd/
The log files for the CSS daemon, cssd, can be found in the following directory:
CRS_home/log/hostname/cssd/
The log files for the EVM daemon, evmd, can be found in the following directory:
CRS_home/log/hostname/evmd/
The log files for the Oracle Cluster Registry (OCR) can be found in the following directory:
CRS_home/log/hostname/client/
Each program that is part of the Oracle RAC high availability component has a subdirectory assigned exclusively for that program. The name of the subdirectory equals the name of the program.
Note:
If any of the Oracle Clusterware components generates a core dump file, then the dump file is located in a subdirectory of the log directory for that component.Checking the Status of the Oracle Clusterware Installation
Use the CRSCTL check command to display the status of an Oracle Clusterware component or daemon.
To determine the condition of your clusterware installation:
-
Log in to the operating system as the
rootuser in a command window. -
Use CRSCTL to check the status of Oracle Clusterware using the following command:
# crsctl check crs
-
Check the status of an individual Oracle Clusterware daemon using the following syntax, where
daemoniscrsd,cssd, orevmd:# crsctl check daemon -
To list the status of all Oracle Clusterware resources running on any node in the cluster, use the following command:
# crsctl status resource -t
This command lists the status of all registered Oracle Clusterware resources, which includes the VIPs, listeners, databases, services, and Oracle ASM instances and disk groups.
Running the Oracle Clusterware Diagnostics Collection Script
The Oracle Clusterware Diagnostics Collection script collects diagnostic information for your Oracle Clusterware installation. The diagnostics provide additional information so that Oracle Support Services can resolve problems. It displays the status of the Cluster Synchronization Services (CSS), Event Manager (EVM), and the Cluster Ready Services (CRS) daemons.
To run the Oracle Clusterware Diagnostics Collection script:
-
In a command window, log in to the operating system as the
rootuser. -
Run the
diagcollection.plscript from the operating system prompt as follows, where Grid_home is the home directory of your Oracle Grid Infrastructure for a cluster installation:# Grid_home/bin/diagcollection.pl --collect
Enabling Debugging of Oracle Clusterware Components
You can enable debugging for the Oracle Cluster daemons, Event Manager (EVM), and their modules by running CRSCTL commands.
To enable debugging of Oracle Clusterware components:
-
In a command window, log in to the operating system as the
rootuser. -
Use the following command to obtain the module names for a component, where
component_nameiscrs,evm,cssor the name of the component for which you want to enable debugging:# crsctl lsmodules component_nameFor example, viewing the modules of the
csscomponent might return the following results:# crsctl lsmodules css The following are the CSS modules :: CSSD COMMCRS COMMNS
-
Use CRSCTL as follows, where
component_nameis the name of the Oracle Clusterware component for which you want to enable debugging,moduleis the name of module, anddebugging_levelis a number from 1 to 5:# crsctl debug log component module:debugging_level
For example, to enable the lowest level of tracing for the
CSSDmodule of thecsscomponent, you would use the following command:# crsctl debug log css CSSD:1
Enabling Debugging for an Oracle Clusterware Resource
You can use CRSCTL commands to enable debugging for resource managed by Oracle Clusterware.
To enable debugging of an Oracle Clusterware resource:
-
In a command window, log in to the operating system as the
rootuser. -
Obtain a list of the resources available for debugging by running the following command:
# crsctl check crs
-
Run the following command to enable debugging, where
resource_nameis the name of an Oracle Clusterware resource, such asora.racnode1.vip, anddebugging_levelis a number from 1 to 5:# crsctl debug log res resource_name:debugging_level
Enabling and Disabling Oracle Clusterware Daemons
When the Oracle Clusterware daemons are enabled, they start automatically when the node is started. To prevent the daemons from starting automatically, you can disable them using crsctl commands.
To enable automatic startup for all Oracle Clusterware daemons:
-
In a command window, log in to the operating system as the
rootuser. -
Run the following CRSCTL command:
# crsctl enable crs
To disable automatic startup for all Oracle Clusterware daemons:
-
In a command window, log in to the operating system as the
rootuser. -
Run the following CRSCTL command:
# crsctl disable crs
Using the Cluster Verification Utility to Diagnose Problems
The Cluster Verification Utility (CVU) can assist you in diagnosing a wide variety of configuration problems.
This section contains the following topics:
Verifying the Existence of Node Applications
You use the CVU comp nodeapp command to verify the existence of node applications, namely the virtual IP (VIP), Oracle Notification Services (ONS), and Global Service Daemon (GSD), on all the nodes.
To verify the existence of node applications:
-
In a command window, log in to the operating system as the user who owns the Oracle Clusterware software installation.
-
Use the
comp nodeappcommand of CVU, using the following syntax:cluvfy comp nodeapp [ -n node_list] [-verbose]where
node_listrepresents the nodes to check. -
If the
cluvfycommand returns the value ofUNKNOWNfor a particular node, then CVU cannot determine whether a check passed or failed. Determine if the failure was caused by one of the following reasons:-
The node is down.
-
Executable files that CVU requires are missing in the
CRS_home/bindirectory or theOracle_home/bindirectory. -
The user account that ran CVU does not have permissions to run common operating system executable files on the node.
-
The node is missing an operating system patch or required package.
-
The kernel parameters on that node were not configured correctly and CVU cannot obtain the operating system resources required to perform its checks.
-
Verifying the Integrity of Oracle Clusterware Components
You use the CVU comp crs command to verify the existence of all the Oracle Clusterware components.
To verify the integrity of Oracle Clusterware components:
-
In a command window, log in to the operating system as the user who owns the Oracle Clusterware software installation.
-
Use the
comp crscommand of CVU, using the following syntax:cluvfy comp crs [ -n node_list] [-verbose]where
node_listrepresents the nodes to check.
Verifying the Integrity of the Oracle Cluster Registry
You use the CVU comp ocr command to verify the integrity of the Oracle Clusterware registry.
To verify the integrity of the Oracle Clusterware registry:
-
In a command window, log in to the operating system as the user who owns the Oracle Clusterware software installation.
-
Use the
comp ocrcommand of CVU, using the following syntax:cluvfy comp ocr [ -n node_list] [-verbose]where
node_listrepresents the nodes to check.
Verifying the Integrity of Your Entire Cluster
You use the CVU comp clu command to check that all nodes in the cluster have the same view of the cluster configuration.
To verify the integrity of your cluster:
-
In a command window, log in to the operating system as the user who owns the Oracle Clusterware software installation.
-
Use the
comp clucommand of CVU, using the following syntax:cluvfy comp clu [-verbose]
Checking the Settings for the Interconnect
Cache Fusion enhances the performance of Oracle RAC by utilizing a high-speed interconnect to send data blocks to another instance's buffer cache. The high-speed interconnect should be a private network with the highest bandwidth to maximize performance.
For network connectivity verification, CVU discovers all the available network interfaces if you do not specify an interface on the CVU command line.
To check the settings for the interconnect:
-
In a command window, log in to the operating system as the user who owns the Oracle Clusterware software installation.
-
To verify the accessibility of the cluster nodes, specified by
node_list, from the local node or from any other cluster node, specified bysrcnode, use the component verification commandnodereachas follows:cluvfy comp nodereach -n node_list [ -srcnode node ] [-verbose]
-
To verify the connectivity among the nodes, specified by
node_list, through the available network interfaces from the local node or from any other cluster node, use thecomp nodeconcommand as shown in the following example:cluvfy comp nodecon -n node_list -verboseWhen you issue the
nodeconcommand as shown in the previous example, it instructs CVU to perform the following tasks:-
Discover all the network interfaces that are available on the specified cluster nodes.
-
Review the corresponding IP addresses and subnets for the interfaces.
-
Obtain the list of interfaces that are suitable for use as VIPs and the list of interfaces to private interconnects.
-
Verify the connectivity among all the nodes through those interfaces.
When you run the
nodeconcommand in verbose mode, it identifies the mappings between the interfaces, IP addresses, and subnets. -
-
To verify the connectivity among the nodes through specific network interfaces, use the
comp nodeconcommand with the-ioption and specify the interfaces to be checked with theinterface_listargument:cluvfy comp nodecon -n node_list -i interface_list [-verbose]
For example, you can verify the connectivity among the nodes
racnode1,racnode2, andracnode3, through the specific network interfaceeth0by running the following command:cluvfy comp nodecon -n racnode1,racnode2,racnode3 -i eth0 -verbose
Enabling Tracing
CVU does not generate trace files unless you enable tracing. The CVU trace files are created in the CRS_home/cv/log directory. Oracle RAC automatically rotates the log files, and the most recently created log file has the name cvutrace.log.0. You should remove unwanted log files or archive them to reclaim disk space, if needed.
-
In a command window, log in to the operating system as the
rootuser. -
Set the environment variable
SRVM_TRACEtotrue.# set SRVM_TRACE=true; export SRVM_TRACE
-
Run the command to trace.
Viewing Oracle RAC Database Alerts
Alert messages are displayed in Enterprise Manager. The Alerts table is similar to that shown for single-instance databases, but in a cluster database, it includes columns for the target name and target type. For example, if a user connected to the orcl1 instance exceeded their allotted login time, then you would see an alert message with the following values:
-
Target name:
orcl_orcl1 -
Target type: Database instance
-
Category: Response
-
Name: User logon time
-
Message: User logon time is 10250 milliseconds
-
Alert triggered: Date and time when the alert condition occurred
To view the alert messages for an Oracle RAC database:
-
On the Cluster Database Home page, scroll down to the section titled Alerts.
The section Related Alerts displays nondatabase alert messages, for example, alert messages for Oracle Net.
-
View the alerts for your database and database instances.
The following screenshot shows an example of the Alerts display for a clustered database named
docrac.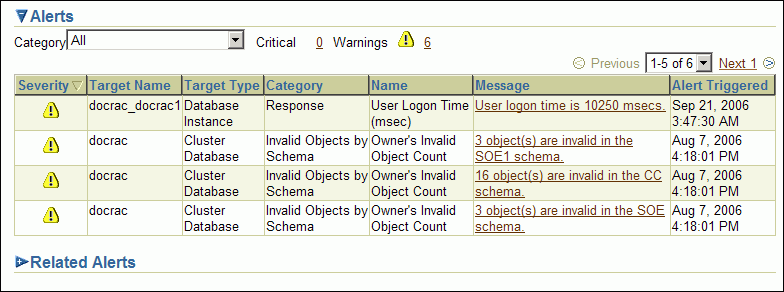
Description of the illustration racalert.gif
Viewing Oracle RAC Database Alert Log Messages
An alert log is created for each instance in a cluster database.
To view the alert log for an Oracle RAC database instance:
-
On the Cluster Database Home page, scroll down to the Instances section.
-
Click the name of the instance for which you want to view the alert log.
The Cluster Database Instance Home page appears.
-
In the Diagnostic Summary section, click the link next to the heading Alert Log to display the alert log entries containing ORA- errors.
The Alert Log Errors page appears.
-
(Optional) Click Alert Log Contents in the Related Links section to view all the entries in the alert log.
On the View Alert Log Contents page, click Go to view the most recent entries, or you can enter your own search criteria.
Monitoring and Tuning Oracle RAC: Oracle By Example Series
Oracle By Example (OBE) has a viewlet, or animated demo, on using ADDM for an Oracle RAC database.
To view the Monitoring and Tuning viewlet using your browser, enter the following URL:
http://www.oracle.com/technetwork/dbadev/index.html
From the menu on the lower left side of the screen, select Database Learning Library. Perform a search using the following parameters:
-
Content Type: Demo
-
Functional Category: Grid
-
Product Suite: Oracle Database 11g (ODB11g)
Click a title to start a demonstration, for example "Use Global ADDM Analysis in a RAC Environment".