10 Monitoring and Tuning the Database
Monitoring the performance of a database and ensuring that it performs optimally is an important task for a database administrator. This chapter discusses the features and functions included in Oracle Database that make it easy to monitor database health, identify performance problems, and implement any corrective actions.
This chapter contains the following topics:
Proactive Database Monitoring
Oracle Database makes it easy to monitor the health and performance of your database. It monitors the vital signs (or metrics) related to database health and performance, analyzes the workload running against the database, and automatically identifies any issues that need your attention as an administrator. The identified issues are presented as alerts and performance findings on the Database Home page. You can also configure Oracle Enterprise Manager Database Control (Database Control) to notify you of issues by e-mail.
This section discusses the following topics:
About Alerts
Alerts help you monitor your database. Most alerts notify you of when particular metric thresholds are exceeded. For each alert, you can set critical and warning threshold values. These threshold values are meant to be boundary values that when exceeded, indicate that the system is in an undesirable state. For example, when a tablespace becomes 97 percent full, this can be considered undesirable, and Oracle Database generates a critical alert.
Other alerts correspond to database events such as Snapshot Too Old or Resumable Session suspended. These types of alerts indicate that the event has occurred.
In addition to notification, you can set alerts to perform some action such as running a script. For instance, scripts that shrink tablespace objects can be useful for a Tablespace Usage warning alert.
By default, Oracle Database issues several alerts, including the following:
-
Archive Area Used (warning at 80 percent full)
-
Broken Job Count and Failed Job Count (warning when goes above 0)
-
Current Open Cursors Count (warning when goes above 1200)
-
Dump Area Used (warning at 95 percent full)
-
Session Limit Usage (warning at 90 percent, critical at 97 percent)
-
Tablespace Space Used (warning at 85 percent full, critical at 97 percent full)
You can modify these alerts and others by setting their metrics.
For more information, see "Managing Alerts".
Performance Self-Diagnostics: Automatic Database Diagnostic Monitor
Oracle Database includes a self-diagnostic engine called Automatic Database Diagnostic Monitor (ADDM). ADDM makes it possible for Oracle Database to diagnose its own performance and determine how any identified problems can be resolved.
To facilitate automatic performance diagnosis using ADDM, Oracle Database periodically collects snapshots of the database state and workload. Snapshots are sets of historical data for specific time periods that are used for performance comparisons by ADDM. The default collection interval for a snapshot is one hour. Snapshots provide a statistical summary of the state of the system at a point in time. These snapshots are stored in Automatic Workload Repository (AWR), residing in the SYSAUX tablespace. The snapshots are stored in this repository for a set time (8 days by default) before they are purged to make room for new snapshots.
ADDM analyzes data captured in AWR to determine the major problems in the system, and usually recommends solutions and quantifies expected benefits. ADDM analysis results are represented as a set of findings.
Generally, the performance problems that ADDM can call attention to include the following:
-
Resource contention (bottlenecks), such as when your database is using large amounts of CPU time or memory due to high load SQL statements
-
Poor connection management, such as when your application is making too many logins to the database
-
Lock contention in a multiuser environment, such as when one user process acquires a lock to safely update data in a table, causing other user processes that must acquire locks against the same table to wait, resulting in a slower database performance
See Also:
-
Oracle Database 2 Day + Performance Tuning Guide for more information about automatic database performance monitoring
Monitoring General Database State and Workload
The Database Home page enables you to monitor the state and workload of your database. It provides a central place for general database state information and is updated periodically.
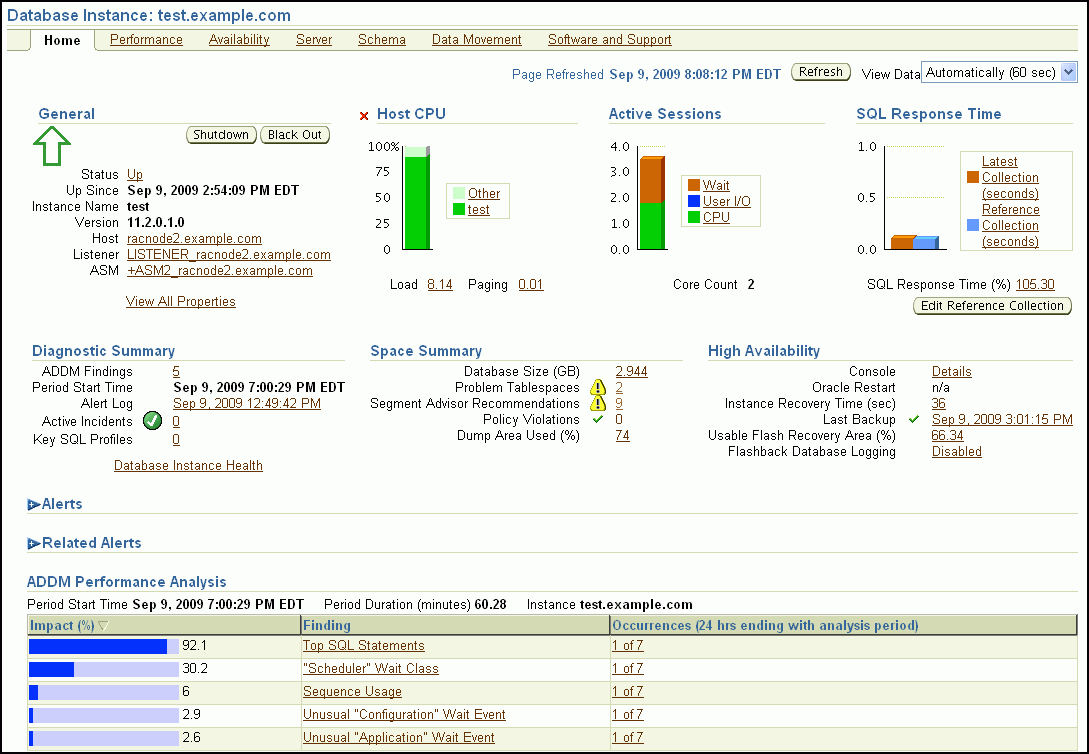
Description of the illustration addm_home_page_new.gif
To monitor the general database state and workload:
-
Go to the Database Home page.
-
(Optional) Click the Refresh button to update the information displayed.
By default, the Database Home page automatically refreshes every 60 seconds. You can prevent automatic refresh by selecting Manually in the View Data list at the top right-hand corner of the page. You must then click Refresh to view the latest information.
The date and time that data was last collected from the database is displayed to the left of the Refresh button.
-
Get a quick overview of the database state in the General section, which includes the following information:
-
Status of the database instance, Up or Down
Click the Status link to drill down to database availability details.
-
Time the database was last started
-
Instance name
-
Oracle Database version
-
Host name
Click the Host link to drill down to host details.
-
Listener name
Click the Listener link to drill down to listener details.
Click View All Properties to see the Oracle home path and whether the database is read-only or read/write.
-
-
View CPU utilization in the Host CPU section, which includes the following information:
-
Bar chart
This chart shows the percentage of CPU time used by the database and other processes. The chart legend contains links for the database instance and for other CPU processes.
Click the Other link in the chart legend to see how the utilization of CPU, memory, and disk I/O change over time.
Click the instance name link in the chart legend to see the Top Activity page. It includes a graph of active sessions over time, details about SQL statements issued, and the most active sessions.
-
CPU load
This is the average number of processes waiting to be scheduled for the CPU in the previous minute.
Click the Load link to see how the utilization of CPU, memory, and disk I/O change over time.
-
Paging
This is the number of memory pages (fixed-length block of instructions, data, or both) that are paged out (moved out of active memory) each second.
Click the Paging link to see how the utilization of CPU, memory, and disk I/O change over time.
-
-
Investigate the Active Sessions section, where you can further explore the cause of performance problems, such as your database taking up most of the CPU time on the server. This section displays a bar graph with the following information:
-
Waits
This is the value for all wait classes combined, excluding user I/O and idle wait events. Wait classes are groupings of wait events based on the type of wait.
If other processes are taking up most of your CPU time, then this indicates that some other application running on the database host computer could be causing performance problems.
Click the Wait link to go to the Performance page to view potential problems inside and outside the database.
-
User I/O
This is the average number of active sessions waiting for user I/O. User I/O means that the workload originating from the user causes the database to read data from disk or write data to disk.
Click the User I/O link to go to the Performance page to view potential problems inside and outside the database.
-
CPU
This is the average active sessions using CPU.
Click the CPU link to see a chart showing more detailed information about active sessions over time.
-
-
View the Diagnostic Summary section, which includes the following information:
-
ADDM Findings
This shows the count of ADDM findings from the most recent ADDM run. Click the number adjacent to the ADDM Findings link to go to the ADDM page.
-
Period Start Time
This is the start time of the time period most recently analyzed by ADDM. It is shown only if there are ADDM findings.
-
Alert Log
This is the timestamp of the most recent alert log entry that describes an
ORA-error.Click the Alert Log link to go to the Alert Log Errors page, which shows a list of log entries that contain errors.
-
Active Incidents
This shows the count of active incidents, which are occurrences of critical errors in the database. You are encouraged to investigate critical errors and report them to Oracle Support Services. Click the count to go to the Support Workbench home page.
-
Database Instance Health
Click Database Instance Health to display the Database Instance Health page, which includes graphical timelines of incidents, ADDM findings, and alerts. You can use these graphs for identifying correlations between incidents and alerts generated and performance issues on the system.
-
-
View the SQL Response Time section.
This is the current response time of a tracked set of SQL statements as compared to the response time for the reference collection. A reference collection, or SQL Tuning Set, is set of SQL statements that represents the typical SQL workload on your production system. If the current response time and reference collection response time are equal, then the system is running as it should. If the current response time is greater than the reference collection response time, then one or more SQL statements are performing more slowly than they should. The lower the current response time, the more efficiently the tracked SQL statements run.
Click the SQL Response Time link to see response time metrics for the previous 24 hours. If the reference collection is empty, then click Reset Reference Collection to go to a page where you can create a reference collection.
-
View the Space Summary section.
If the number adjacent to the Segment Advisor Recommendations label is not zero, then it means the Segment Advisor has identified candidate segments for space defragmentation. Click the number to view recommendations for how to defragment these segments.
-
View the Alerts section, which includes the following items:
-
Category list
Optionally choose a category from the list to view alerts only in that category.
-
Critical
This is the number of metrics that have exceeded critical thresholds plus the number of other critical alerts, such as those caused by incidents (critical errors).
-
Warning
This is the number of metrics that have exceeded warning thresholds.
-
Alerts table
Click the message to learn more about the alert.
-
-
View the ADDM Performance Analysis section, if present. This section contains the following items:
-
Period Start Time
This is the start time of the period most recently analyzed by ADDM.
-
Period Duration in minutes
This is the duration of the period most recently analyzed by ADDM.
-
Instance name
-
ADDM findings table
This table lists the ADDM findings, their estimated impact on database performance, a description of the finding, and the number of times the finding occurred in snapshots collected during the previous 24 hours. For example, a finding with Occurrences listed as 34 of 43 has occurred in 34 of the last 43 snapshots.
Click the finding to view finding details, to view recommendations, and in some cases to implement recommendations or start advisors.

Description of the illustration perfanalysishpcr.gif
-
To view database performance over time:
-
At the top of the Database Home page, click Performance.
The Performance page appears, displaying a summary of CPU utilization, average active sessions, instance disk I/O, and instance throughput for the recent time period.
-
Use the Additional monitoring links to drill down to Top Activity and other data.
The types of actions you can take to improve host performance depends on your system, and can include eliminating unnecessary processes, adding memory, or adding CPUs.
Managing Alerts
The following topics describe how to manage alerts:
Viewing Metrics and Thresholds
To effectively diagnose performance problems, statistics must be available. Oracle generates many types of cumulative statistics for the system, sessions, and individual SQL statements. Oracle also tracks cumulative statistics on segments and services. A metric is defined as the rate of change in some cumulative statistic. Metrics are computed and stored in Automatic Workload Repository, and are displayed on the All Metrics page, which can be viewed by clicking All Metrics under Related Links on the Database Home page.
To view metrics for your database:
-
On the Database Home page under Related Links, click All Metrics.
The All Metrics page appears.
-
Click a specific metric link.
A details page appears, with more information about the metric. Online Help for this page describes the metric.
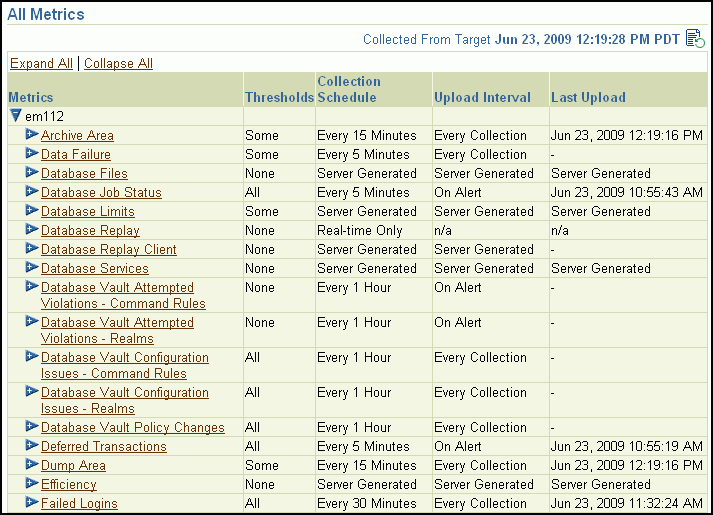
Description of the illustration metrics_11gr2.gif
For each of these metrics, you are able to define warning and critical threshold values, and whenever the threshold is exceeded, Oracle Database issues an alert. Alerts are displayed on the Database Home page under the Alerts heading (or Related Alerts for nondatabase alerts such as a component of Oracle Net).
The following sample output shows two warning alerts for the threshold Tablespace Space Used.

Description of the illustration alerts_with_metrics1_new.gif
Setting thresholds is discussed in "Setting Metric Thresholds". Actions you might take to respond to alerts are discussed in "About Responding to Alerts".
When the condition that triggered the alert is resolved and the metric value is no longer outside the boundary, Oracle Database clears the alert. Metrics are important for measuring the health of the database and serve as input for self-tuning and recommendations made by Oracle Database advisors.
Setting Metric Thresholds
Oracle Database provides a set of predefined metrics, some of which have predefined thresholds. There may be times when you want to set thresholds for other metrics, or you want to alter existing threshold settings.
"Changing Space Usage Alert Thresholds for a Tablespace" describes one means of setting a threshold, where you set warning and critical thresholds on the amount of space consumed in a tablespace. A more general means of setting thresholds is available using the Edit Thresholds page.
-
Go to the Database Home page.
-
Under the Related Links heading, click Metric and Policy Settings.
The Metric and Policy Settings page appears.
This page displays the existing thresholds for metrics and any response actions that have been specified.
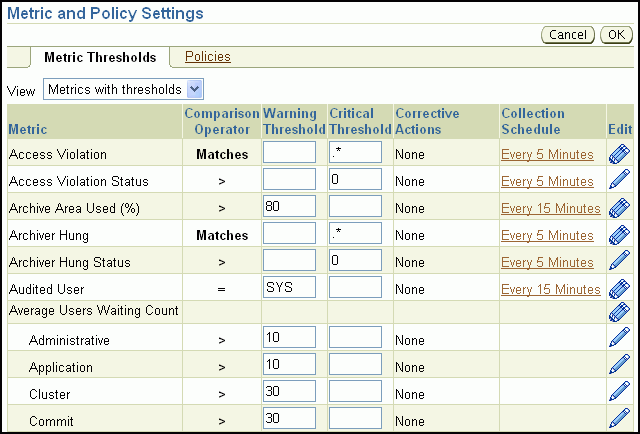
Description of the illustration editthreshold_11g.gif
-
In the View list, do one of the following:
-
Select Metrics with thresholds to view only those metrics with thresholds, either predefined by Oracle or previously set by you.
-
Select All Metrics to view all metrics, whether they have thresholds defined.
-
-
To set or modify a warning threshold for a particular metric, enter the value you want in the Warning Threshold field for that metric.
-
To set or modify a critical threshold for a particular metric, enter the value you want in the Critical Threshold field for that metric.
-
To disable or reenable metric collection for a particular metric, or to change its collection schedule, complete the following steps:
-
Click the Collection Schedule link for the metric.
The Edit Collection Settings page for that metric appears.
-
Click Disable to disable collection for this metric, or click Enable to enable it.
-
If you chose Enable, then you must choose the Frequency Type for the Collection Schedule and enter a numeric value in the Repeat Every field.
If you chose Disable, then skip this step.
-
Do one of the following:
-
Click Continue to save your choices and return to the Metric and Policy Settings page.
-
Click Cancel to return to the Metric and Policy Settings page without saving your choices.
-
-
-
Click a single-pencil icon to use the Edit Advanced Settings page to make changes to Corrective Actions, (Monitoring) Template Override, and Advanced Threshold Settings. Click Help on this page for more information about these options.
-
Click a triple-pencil icon to set different threshold values for different instances of the object type being measured.
For example, for each tablespace you can set different warning and critical levels for the Tablespace Space Used metric.
-
Do one of the following:
-
Click OK to save your changes and return to the Database Home page.
-
Click Cancel to return to the Database Home page without saving your changes.
-
About Responding to Alerts
When you receive an alert, follow any recommendations it provides, or consider running ADDM or another advisor, as appropriate, to get more detailed diagnostics of system or object activity.
For example, if you receive a Tablespace Space Usage alert, then you might take a corrective measure by running the Segment Advisor on the tablespace to identify possible objects for shrinking. You can then shrink the objects to create available (free) space. See "Reclaiming Unused Space".
Additionally, as a response, you can set a corrective script to run as described in "Setting Metric Thresholds".
Clearing Alerts
Most alerts are cleared (removed) automatically when the cause of the problem disappears. Other alerts, such as Generic Alert Log Error, are sent to you for notification and must be acknowledged by the database administrator.
After taking the necessary corrective measures, you can acknowledge an alert by clearing or purging it. Clearing an alert sends the alert to the Alert History, which can be viewed from the Database Home page under Related Links. Purging an alert removes it from the Alert History.
-
On the Database Home page under Diagnostic Summary, click the Alert Log link.
The Alert Log Errors page appears.
-
From the View Data list, select the period for which you want information.
-
Click Refresh to refresh the page with the latest information.
-
Do one of the following:
-
Click Show Open Alerts to hide alerts that have been cleared.
-
Click Show Open and Cleared Alerts to see all alerts.
Note:
You will see only one or the other of these buttons, depending on what is currently displayed. -
-
Select one or more alerts by clicking their Select options.
-
Click Clear to clear the alert.
-
Click Purge to purge the alert.
-
Click Clear Every Open Alert to clear all open alerts.
-
Click Purge Every Alert to purge all alerts.
Setting Up Direct Alert Notification
Database Control displays all alerts on the Database Home page. However, you can optionally specify that Database Control provide you direct notification when specific alerts arise. For example, if you choose e-mail notification for critical alerts, and you have a critical threshold set for the system response time for each call metric, then you might be sent an e-mail message similar to the following:
Host Name=mydb.us.example.com
Metric=Response Time per Call
Timestamp=08-NOV-2006 10:10:01 (GMT -7:00)
Severity=Critical
Message=Response time per call has exceeded the threshold. See the
latest ADDM analysis.
Rule Name=
Rule Owner=SYSMAN
The e-mail message contains a link to the host name and the latest ADDM analysis.
By default, alerts in critical state such as DB Down, Generic Alert Log Error Status, and Tablespace Space Used are set up for notification. However, to receive these notifications, you must set up your e-mail information.
To set up your e-mail information:
-
From any Database Control page, click the Setup link, which is visible in the header and footer areas.
-
On the Setup page, select Notification Methods.
-
Enter the required information into the Mail Server section of the Notifications Methods page. Click Help at the bottom of the page for assistance.
There are other methods of notification, including scripts and SNMP (Simplified Network Management Protocol) program interrupts (traps). The latter can be used to communicate with third-party applications.
At this point, you have set up a method of notification, but you have not set up an e-mail address to receive the notification. To do so, complete the following steps.
-
From any Database Control page, click the Preferences link, which is visible in the header and footer areas.
-
On the Preferences page, select General. Click Add Another Row in the E-mail Addresses section to enter your e-mail address.
-
Click Test to verify that e-mail messages can be sent using the specified information. After the test completes, click OK.
-
(Optional) To edit notification rules, for example to change the severity state for receiving notification, select Rules under the heading Notification on the left-hand side of the page.
The Notification Rules page appears. Click Help for more information about this page.
See Also:
-
Oracle Enterprise Manager Advanced Configuration,for more information about configuring notification rules
Diagnosing Performance Problems Using ADDM
At times, database performance problems arise that require your diagnosis and correction. Usually, these problems are brought to your attention by Automatic Database Diagnostic Monitor (ADDM), which does a top-down system analysis every hour by default, and reports its most significant findings on the Database Home page.
This section contains the following topics:
Viewing a Summary of ADDM Performance Findings
ADDM analysis results consist of a description of each finding and a recommended action. You can view a summary of findings and their impacts on the system.
To view a summary of ADDM performance findings:
-
Go to the Database Home page.
-
In the Diagnostic Summary section of the Database Home page, locate the numeric link next to the ADDM Findings label.
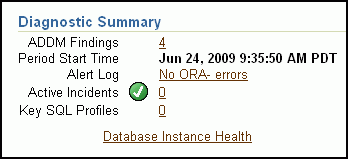
Description of the illustration diagnostic_summary_section.gif
The number indicates the number of findings from the most recent ADDM run. If this number is zero, then there are no ADDM findings to investigate.
If this number is not zero, then continue to Step 3.
-
View the ADDM Performance Analysis section, below the Alerts section of the Database Home page.

Description of the illustration perfanalysishpcr.gif
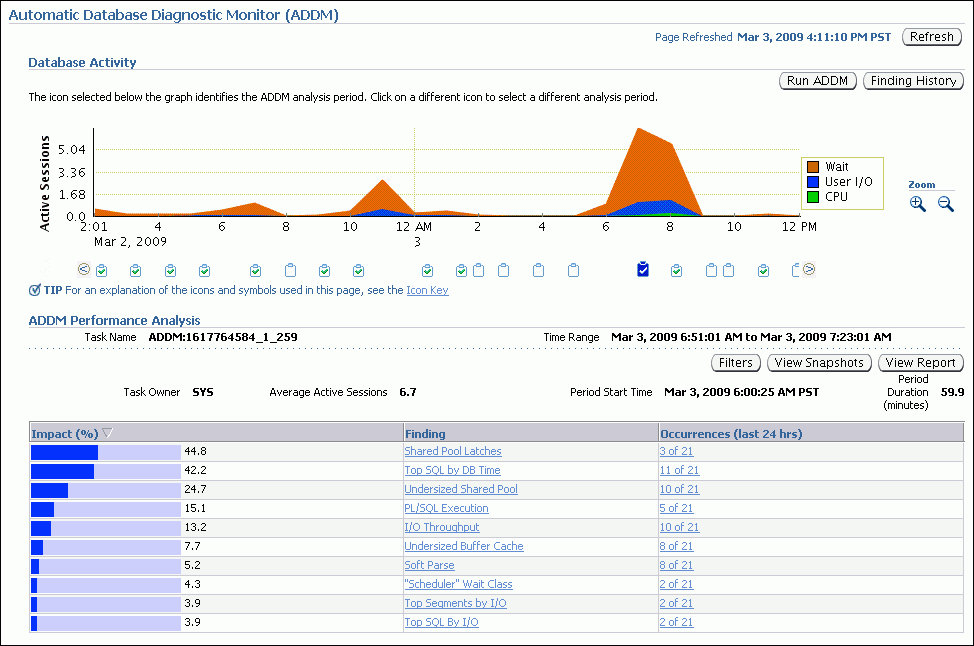
This section is present only if there are ADDM findings. It displays the first five findings from the most recent ADDM run. If there are more than five findings, then controls appear to enable you to view the next five findings, and so on.
-
In the Diagnostic Summary section of the Database Home page, locate the nonzero numeric link next to the ADDM Findings label, and click it.
The ADDM page appears, showing a summary of all findings from the most recent run, and a graphical timeline showing session activity over the past 24 hours.
Description of the illustration performance_addm_page.gif
Click Help for more information about this page.
Each clipboard icon beneath the graph represents a time range within the 24 hours. Click an icon to view findings for the ADDM run that took place during that icon's time range. If more than one ADDM run occurred during that time range, then you can select an individual ADDM run from the list that appears next to the Task Name label.
Responding to ADDM Performance Findings
You can act upon the recommendations that accompany ADDM performance findings.
To respond to ADDM performance findings:
-
In the ADDM Performance Analysis section of either the Database Home page or the ADDM page, in the Finding column, click a finding.
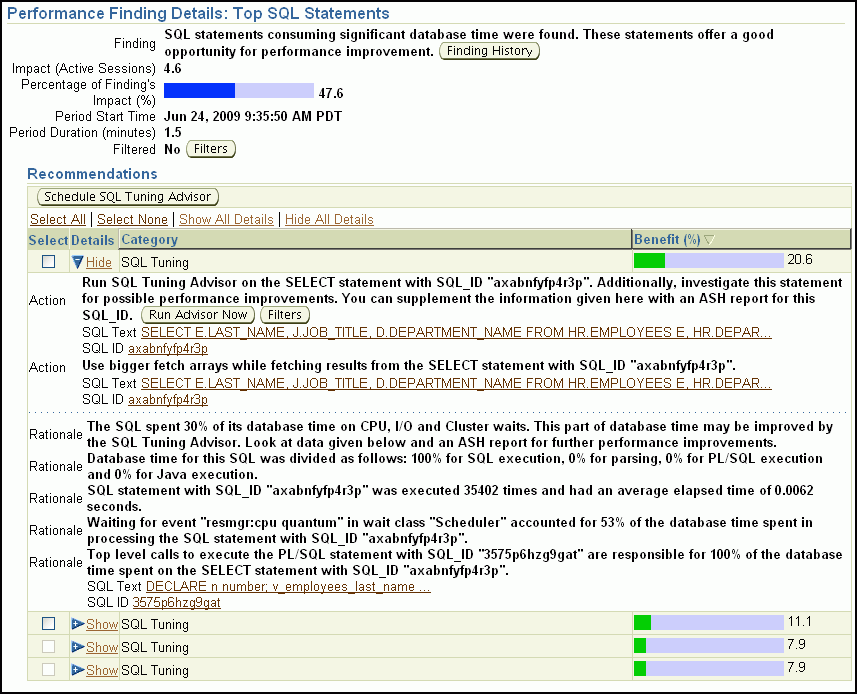
The Performance Finding Details page appears.
Description of the illustration sqltuning_adv_2_11gr2.gif
-
In the Recommendations section, click Show All Details.
-
Choose a finding to respond to, and follow the recommended action. A recommendation can include running an advisor, which you can do by clicking Run Advisor Now.
-
(Optional) Select one or more findings, and then click the action button above the table of findings. An example of an action button might be Schedule SQL Tuning Advisor.
Running ADDM Manually
By default, Oracle Database runs ADDM every hour, immediately after an AWR snapshot. Performance findings from the most recent ADDM run, if any, are listed on the Database Home page. See "Performance Self-Diagnostics: Automatic Database Diagnostic Monitor" for more information.
You can also run ADDM manually. Reasons for doing so include running it as a recommended action associated with an alert or running it across multiple snapshots.
|
Note: If you need more frequent ADDM reporting, then you can also modify the default snapshot interval. To do so, see "Modifying AWR Snapshot Frequency and Retention". |
The following steps describe how to run ADDM to analyze a period that spans multiple snapshots.
-
Go to the Database Home page.
-
Under Related Links at the bottom of the page, click Advisor Central.
The Advisor Central page appears.
-
Click ADDM.
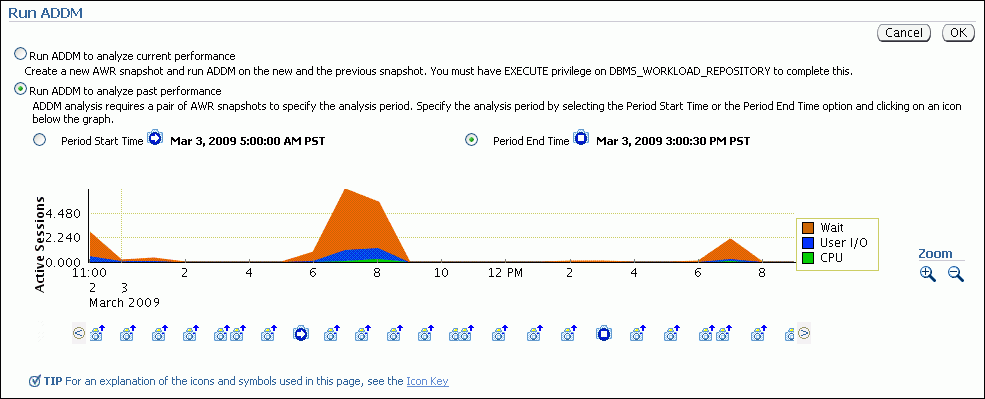
The Run ADDM page appears.
Description of the illustration run-addm.gif
-
Select Run ADDM to analyze past performance.
-
Complete the following steps to choose a period start time:
-
Select the Period Start Time option.
-
(Optional) Examine the timeline graph and note the number of snapshots available in each 2-hour period. Each snapshot is represented by a camera icon. If your snapshots occur more frequently than once each hour and you want to view the timeline of snapshots with more precision, then click the zoom-in icon at the right. (The zoom-in icon is a magnifying glass with a plus-sign.)
-
(Optional) Below the timeline graph, click the left-arrow icon or right-arrow icon at the left and right sides of the page to change the period shown in the timeline graph.
-
Click a camera icon.
A bold right arrow indicating period start time covers the camera icon, and the Period Start Time field above the timeline graph changes to the selected date and time.
-
-
If you want a period end time other than the default (the most recent snapshot), then complete the following steps:
-
Above the timeline graph, select the Period End Time option.
-
(Optional) Click the left-arrow icon or right-arrow icon at the left and right sides of the page to change the period shown in the timeline graph.
-
Click a camera icon.
A bold square (like a stop button on a recording device) covers the camera icon, and the Period End Time field changes to the selected date and time.
-
-
Click OK to start the analysis.
After a short delay, the Automatic Database Diagnostic Monitor page appears, showing its findings.
-
(Optional) In the Task Name list, note the task name.
A typical task name is "Task_52." You can return to this analysis at a later time by searching for and selecting the task name in the Advisor Central page.
Modifying AWR Snapshot Frequency and Retention
ADDM analysis is based on AWR snapshots, which have a default frequency of once each hour and a default retention period of 8 days.
Note:
The snapshot retention period does not apply to preserved snapshots, which are retained forever. A preserved snapshot set is typically created to define a reference period for performance analysis.You can view and alter these AWR snapshot settings.
To modify AWR snapshot frequency and retention:
-
Go to the Database Home page.
-
At the top of the page, click Server to display the Server page.
-
In the Statistics Management section, click Automatic Workload Repository.
The Automatic Workload Repository page appears.
-
Click Edit.
The Edit Settings page appears.
-
Enter new snapshot retention settings or new snapshot collections settings, and then click OK.
Using Advisors to Optimize Database Performance
Oracle Database includes a set of advisors to help you manage and tune your database. This section contains background information about these advisors and instructions for their use. The following topics are covered:
About Advisors
Advisors are powerful tools for database management. They provide specific advice on how to address key database management challenges, covering a wide range of areas including space, performance, and undo management. In general, advisors produce more comprehensive recommendations than alerts. This is because alert generation is intended to be low cost and have minimal impact on performance, whereas advisors consume more resources and perform more detailed analysis. This, along with the what-if capability of some advisors, provides vital information for tuning that cannot be procured from any other source. You run advisors from Oracle Enterprise Manager Database Control (Database Control). Some are also run automatically during maintenance windows (time periods).
Advisors are provided to help you improve database performance. These advisors include Automatic Database Diagnostic Monitor (ADDM), SQL advisors, and memory advisors. For example, the Shared Pool Advisor, graphically displays the impact on performance of changing the size of this component of the System Global Area (SGA).
You can run a performance advisor when faced with the following situations:
-
You want to resolve a problem in a specific area, for example, to determine why a given SQL statement is consuming 50 percent of CPU time and what to do to reduce its resource consumption.You can use the SQL Tuning Advisor.
-
During application development, you want to tune a new schema and its associated SQL workload for optimal performance. You can use the SQL Access Advisor.
-
You are planning to add memory to your system. You can use the Memory Advisor to determine the database performance impact of increasing your SGA or PGA (Program Global Area).
You can run all advisors from the Advisor Central home page, accessible through a link on the Database Home page. You can also invoke many of the advisors from the Performance page, through recommendations from ADDM, or from alerts.
Table 10-1 describes the performance advisors. Other advisors are listed in Table 10-2.
Table 10-1 Performance Advisors
| Advisor | Description |
|---|---|
|
ADDM makes it possible for Oracle Database to diagnose its own performance and determine how any identified problems can be resolved.See "Performance Self-Diagnostics: Automatic Database Diagnostic Monitor" and "Diagnosing Performance Problems Using ADDM". |
|
|
The SQL Tuning Advisor analyzes one or more SQL statements and makes recommendations for improving performance. This advisor is run automatically during the maintenance periods, but can also be run manually. See "About the Automatic SQL Tuning Advisor" and "Running the SQL Tuning Advisor". The SQL Access Advisor tunes a schema to a given SQL workload. For example, the SQL Access Advisor can provide recommendations for creating indexes, materialized views, or partitioned tables for a given workload. See "Running the SQL Access Advisor". |
|
The Memory Advisors provide graphical analyses of total memory target settings, SGA and PGA target settings, or SGA component size settings. You use these analyses to tune database performance and for what-if planning. Depending on the current memory management mode, different memory advisors are available.
See "Optimizing Memory Usage with the Memory Advisors". See "Managing Memory" for more information about memory management modes. |
| Advisor | Description |
|---|---|
|
The Segment Advisor provides advice on whether a segment is a good candidate for a shrink operation based on the level of space fragmentation within that segment. The advisor also reports on the historical growth trend of segments. You can use this information for capacity planning and for arriving at an informed decision about which segments to shrink. See "Reclaiming Unused Space". |
|
|
The Undo Advisor assists in correctly sizing the undo tablespace. The Undo Advisor can also be used to set the low threshold value of the undo retention period for any Oracle Flashback requirements. See "Computing the Minimum Undo Tablespace Size Using the Undo Advisor". |
About the SQL Advisors
The SQL advisors examine a given SQL statement or a set of SQL statements and provide recommendations to improve efficiency. These advisors can make various types of recommendations, such as creating SQL profiles (a collection of information that enables the query optimizer to create an optimal execution plan for a SQL statement), restructuring SQL statements, creating additional indexes, materialized views, or partitions, and refreshing optimizer statistics. Oracle Enterprise Manager Database Control (Database Control) enables you to accept and implement many of these recommendations with just a few mouse clicks.
The two SQL advisors are the SQL Tuning Advisor and the SQL Access Advisor.
You use the SQL Tuning Advisor to tune a single or multiple SQL statements. Typically, you run this advisor in response to an ADDM performance finding that recommends its use. You can also run it periodically on the most resource-intensive SQL statements, and on a SQL workload.
When tuning multiple SQL statements, the SQL Tuning Advisor does not recognize interdependencies between the SQL statements. It solves SQL performance problems by identifying problems with individual SQL statements, such as a poorly performing optimizer plan or the mistaken use of certain SQL structures.
You can run the SQL Tuning Advisor against the following sources:
-
Top Activity—The most resource-intensive SQL statements executed during the last hour. Use this option to tune SQL statements that might have caused recent performance problems.
-
Historical SQL— A set of SQL statements over any 24 hour window (time period). Use this option for proactive tuning of SQL statements.
-
SQL Tuning Sets (STS)—A set of SQL statements you provide. An STS can be created from SQL statements captured by AWR snapshots or from any SQL workload.
The SQL Access Advisor is primarily responsible for making schema modification recommendations. It can recommend that you create access structures such as indexes and materialized views to optimize SQL queries. It can also recommend that you partition tables, indexes, or materialized views to improve query performance.
The SQL Access Advisor takes a SQL workload as input. You can select your workload from different sources, including current and recent SQL activity, a SQL repository, or a user-defined workload such as from a development environment. The advisor then makes recommendations to improve the performance of the workload as a whole.
Statement Tuning and Workload Tuning
Note that both the SQL Tuning Advisor and the SQL Access Advisor provide index creation recommendations. The SQL Tuning Advisor recommends creation of indexes only when it anticipates exceptional performance gains for the SQL statement being tuned. However, creation of new indexes may adversely impact the performance of DML insert, update, and delete operations. The SQL Tuning advisor does not take this into account while generating new index recommendations.
The SQL Access Advisor, however, considers the impact of new indexes on the complete workload. As such, if an index improves performance of one SQL statement but adversely impacts the rest of the workload, then the new index is not recommended by the SQL Access Advisor. For this reason, the SQL Tuning Advisor always recommends validating its new index recommendation by running the SQL Access Advisor.
See Also:
-
Oracle Database 2 Day + Performance Tuning Guide for more information about tuning SQL statements with the SQL Tuning Advisor
-
Oracle Database 2 Day + Performance Tuning Guide for more information about the SQL Access Advisor
About the Automatic SQL Tuning Advisor
Beginning with Oracle Database 11g, the SQL Tuning Advisor runs automatically during system maintenance windows (time periods) as a maintenance task. During each automatic run, the advisor selects high-load SQL queries in the system and generates recommendations on how to tune these queries.
The Automatic SQL Tuning Advisor can be configured to automatically implement SQL profile recommendations. A SQL profile contains additional SQL statistics that are specific to the SQL statement and enable the query optimizer to generate a significantly better execution plan at run time. If you enable automatic implementation, then the advisor creates SQL profiles for only those SQL statements where the performance increase would be at least threefold. Other types of recommendations, such as the creation of new indexes, refreshing optimizer statistics, or restructuring SQL, can be implemented only manually. DML statements are not considered for tuning by the Automatic SQL Tuning Advisor.
You can view a summary of the results of automatic SQL tuning over a specified period (such as the previous 7 days), and a detailed report about recommendations made for all SQL statements that the SQL Tuning Advisor has processed. You can then implement selected recommendations. You can also view the recommendations that were automatically implemented.
You can control when the Automatic SQL Tuning Advisor runs, and you can disable it if desired.
See Also:
-
Oracle Database Administrator's Guide for more information about automated maintenance tasks
Configuring the Automatic SQL Tuning Advisor
The following are some configuration tasks that you might want to perform for the Automatic SQL Tuning Advisor:
-
Enable automatic implementation of SQL profile recommendations.
Automatic implementation is disabled by default.
-
Select the maintenance windows (time periods) in which the advisor runs.
The Automatic SQL Tuning Advisor runs in all maintenance windows by default.
-
Modify the start time and duration of existing maintenance windows or create new maintenance windows.
To configure the Automatic SQL Tuning Advisor:
-
Go to the Database Home page, logging in as user
SYS. -
Click Server to display the Server page.
-
In the Oracle Scheduler section, click Automated Maintenance Tasks.
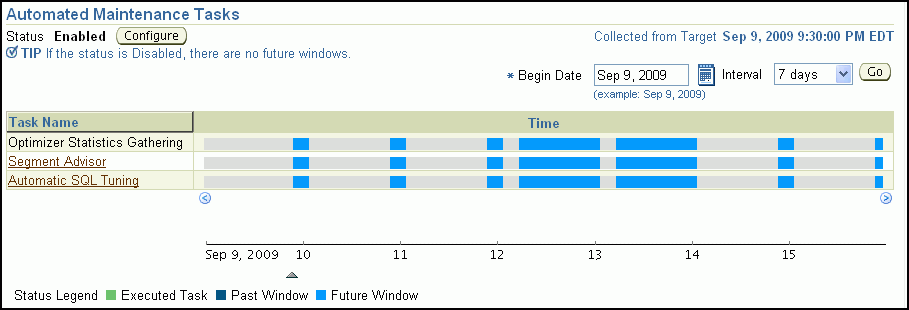
The Automated Maintenance Tasks page appears.
Description of the illustration auto_maint_tasks_new.gif
-
Click Configure.
The Automated Maintenance Tasks Configuration page appears.
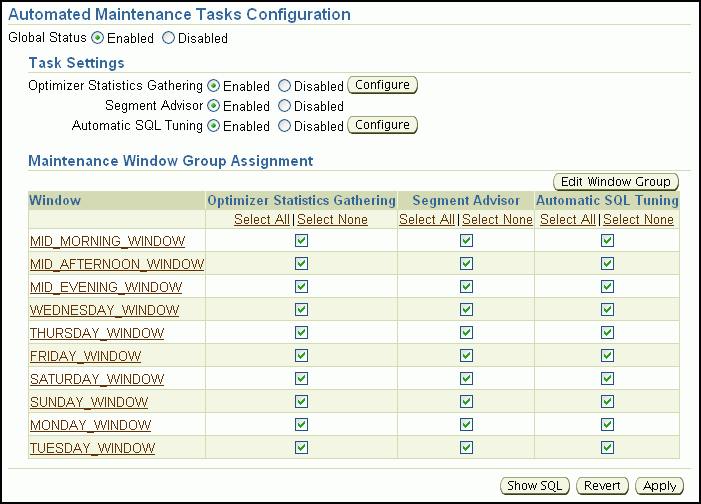
Description of the illustration auto_maint_task_config.gif
-
(Optional) To disable the Automatic SQL Tuning Advisor, in the Task Settings section, click the Disabled option for Automatic SQL Tuning.
-
(Optional) To prevent the Automatic SQL Tuning Advisor from running in particular maintenance windows, in the Maintenance Window Group Assignment section, deselect check boxes under the Automatic SQL Tuning heading.
-
Click Apply to save any changes made so far.
A confirmation message is displayed.
-
To enable automatic implementation of SQL profile recommendations, complete the following steps:
-
In the Task Settings section, next to the Automatic SQL Tuning options, click Configure.
The Automatic SQL Tuning Settings page appears.
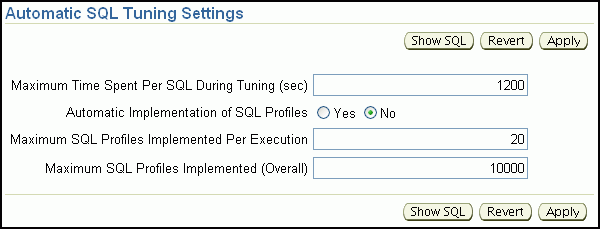
Description of the illustration auto_sqltuning_settings.gif
-
Next to Automatic Implementation of SQL Profiles, click the Yes option.
You must be logged in as user
SYSto change this option. -
Click Apply.
A confirmation message is displayed.
-
In the locator links at the top, left-hand side of the page, click Automated Maintenance Tasks Configuration to return to the Automated Maintenance Tasks Configuration page.
-
-
(Optional) To make changes to the start time and duration of existing maintenance windows, to disable individual maintenance windows, or to create additional maintenance windows, click Edit Window Group.
The Edit Window Group page appears. From this page you can change the settings of individual windows or you can add or remove windows to or from the window group
MAINTENANCE_WINDOW_GROUP.See the online Help for this page for more information.
Note:
If you create a new window (time period) to run automated maintenance tasks, then you must add that window toMAINTENANCE_WINDOW_GROUP.
See Also:
-
Oracle Database Administrator's Guide for more information about maintenance windows and how to configure them
Viewing Automatic SQL Tuning Results
You can track the activities of the Automatic SQL Tuning Advisor with Database Control.
To view automatic SQL tuning results:
-
Go to the Database Home page.
-
Click Server to display the Server page.
-
In the Oracle Scheduler section, click Automated Maintenance Tasks.
The Automated Maintenance Tasks page appears.
-
Click Automatic SQL Tuning.
The Automatic SQL Tuning Result Summary page appears, showing graphical summaries of the Automatic SQL Tuning Advisor activities and findings.
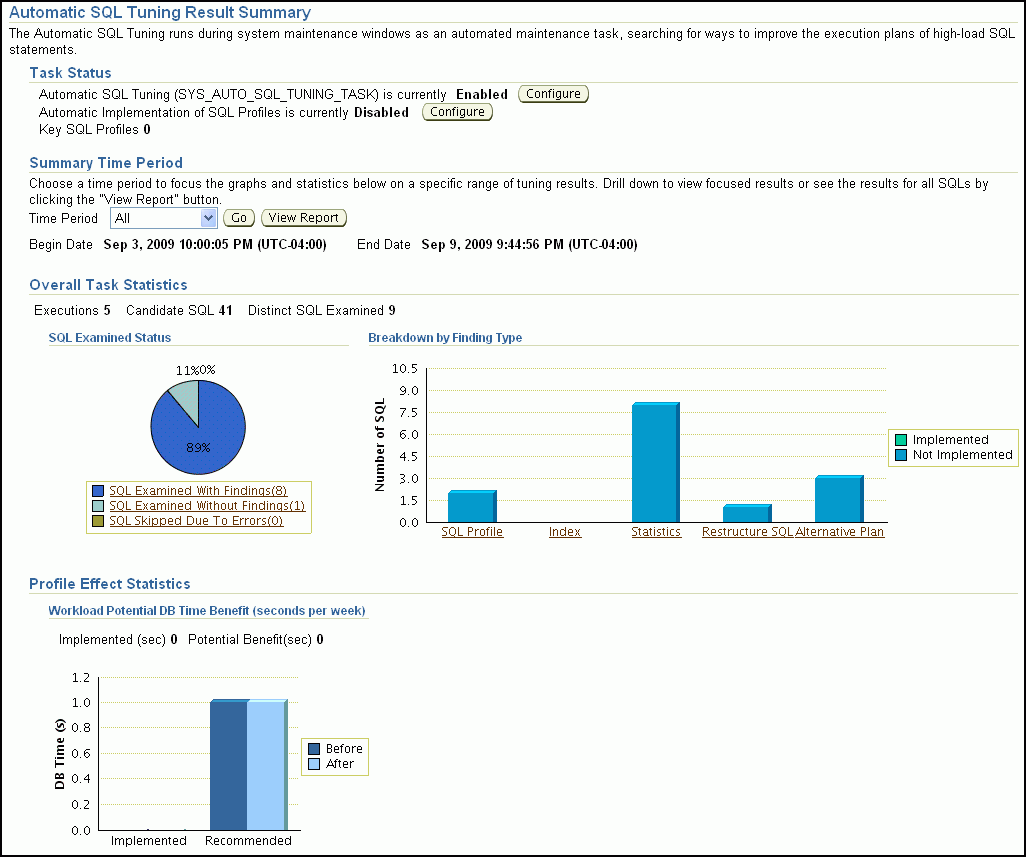
Description of the illustration auto_sqltuning_r2_new.gif
-
To view recommendations, click View Report under the heading Task Activity Summary.
The Automatic SQL Tuning Result Details page appears, showing the SQL statements for which recommendations were made during the designated period.
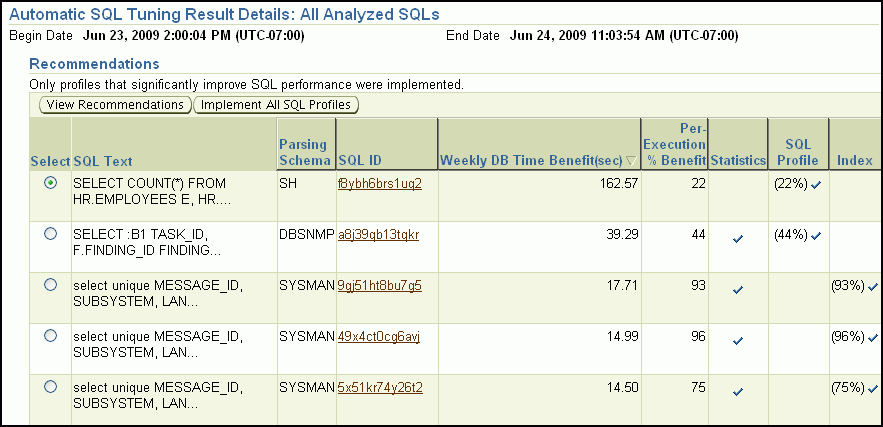
Description of the illustration sql_tuning_auto_result_det.gif
A green check mark in the SQL Profile column indicates a recommendation that was automatically implemented.
By default, automatic implementation is disabled. See "Configuring the Automatic SQL Tuning Advisor" for instructions for enabling it.
-
(Optional) Select a SQL statement in the Recommendations table (based on the SQL Text column), and then click View Recommendations.
The Recommendations for SQL ID page appears, describing each recommendation for the statement in detail. On this page, you can select a recommendation and then click Implement to implement it.
Running the SQL Tuning Advisor
Use the SQL Tuning Advisor for tuning SQL statements. Typically, you run this advisor in response to an ADDM performance finding that recommends its use. You can also start the SQL Tuning Advisor manually. One reason is to tune statements that the Automatic SQL Tuning Advisor has not considered for tuning.
As described in "About the SQL Advisors", the SQL Tuning Advisor can select SQL statements to tune from several sources. The following scenario assumes that you want to tune the SQL statements with the most activity:
To run the SQL Tuning Advisor:
-
Go to the Database Home page.
-
At the bottom of the page, under Related Links, click Advisor Central.
-
On the Advisor Central page, click SQL Advisors.
-
On the SQL Advisors page, click SQL Tuning Advisor.
The Schedule SQL Tuning Advisor page appears.
-
In the Overview section, select the Top Activity data source link.
The Top Activity page appears. This page has a timeline graph showing the database activity based on the active sessions over the last hour.
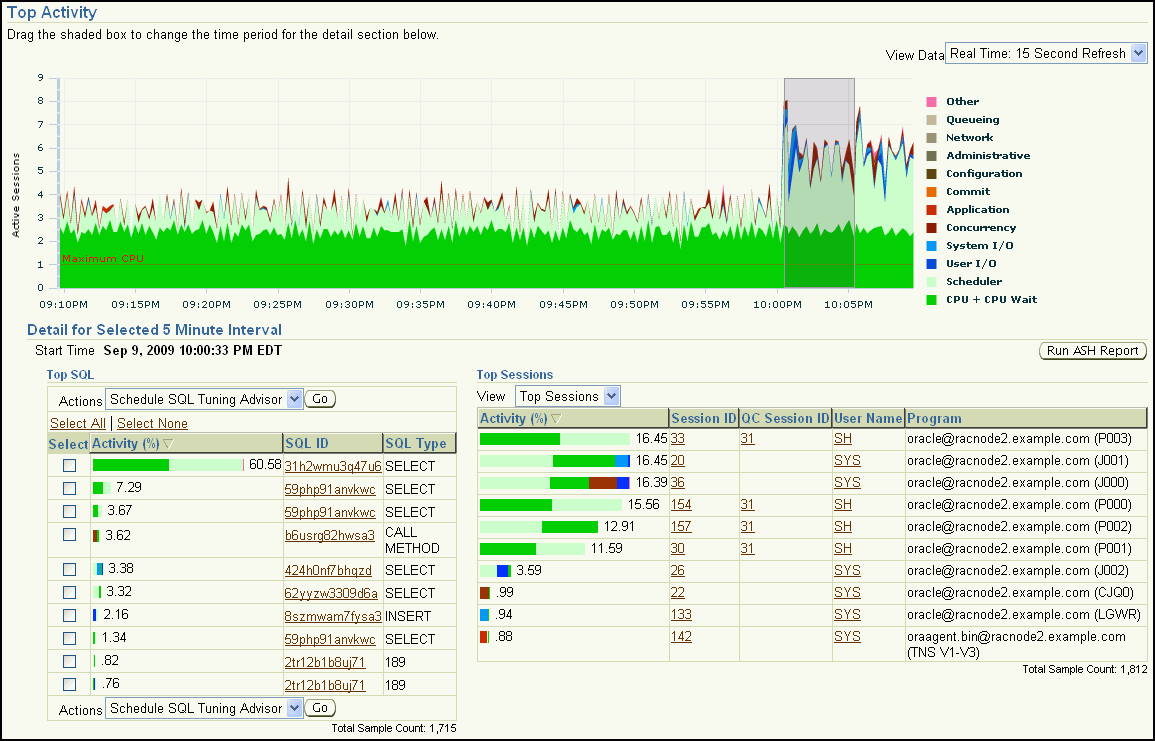
Description of the illustration top_activity_new.gif
-
(Optional) Expand the timeline by selecting Historical from the View Data list at the upper right-hand side of the page.
-
Select an interval to analyze by clicking the bar under the timeline graph.
The Top SQL and Top Sessions tables show the activity within the selected period.
-
In the Top SQL section, select one or more SQL statements. Make sure the Actions drop-down list shows Schedule SQL Tuning Advisor, and then click Go.
The Schedule SQL Tuning Advisor page returns, indicating the statements that are to be tuned.
-
Enter a task name and description, select the scope for the analysis (Comprehensive or Limited), and select a start time for the analysis task.
-
Click Submit.
A Processing SQL Tuning Advisor Task page appears. When the task is complete, the SQL Tuning Result Summary page appears, showing a summary of the SQL Tuning Advisor findings for the SQL statements analyzed.
To view the recommendations, click Show all results. The recommendations can include one or more of the following:
-
Accept the generated SQL profile.
-
Gather optimizer statistics on objects with stale or no statistics.
-
Rewrite a query for better performance.
-
Create an index to offer alternate, faster access paths to the query optimizer.
-
-
To view recommendations for a specified SQL statement, select a statement from the list of recommendations, and then click View Recommendations.
The Recommendations for SQL ID page appears, showing one or more recommendations for the statement.
-
(Optional) Select a recommendation, and then click Implement.
After you confirm that you want to implement a new profile, you are returned to the Recommendations for SQL ID page, and a confirmation notice is printed across the top of the page.
Running the SQL Access Advisor
You run the SQL Access Advisor to get recommendations for improving the performance of a workload. You can run it on a periodic basis to avoid performance problems, or run it to verify schema change recommendations from the SQL Tuning Advisor.
To run the SQL Access Advisor:
-
Go to the Database Home page.
-
At the bottom of the page, under Related Links, click Advisor Central.
-
On the Advisor Central page, click SQL Advisors.
-
On the SQL Advisors page, click SQL Access Advisor.
A page appears prompting you for initial options. Click Help for information about the options for this page.
-
Select an option, and then click Continue.
-
The Workload Source page appears. It is the first page of the SQL Access Advisor wizard.
Click Help to obtain help for this and subsequent wizard pages. Follow directions and make the required selections for each wizard page, clicking Next when you are ready to proceed to the next page.
-
Continue through the wizard until you reach the Review page. Review your selections and then click Submit to start the analysis.
The Advisor Central page appears, displaying a confirmation message indicating that your task has been started successfully.
-
Click the Refresh button (not your browser's Refresh icon) to view the status of your task.
-
When your SQL Access Advisor task has completed, select View Result.
The Result for Task page appears.
The Summary subpage shows you the potential for improvement under the headings Workload I/O Cost and Query Execution Time Improvement.
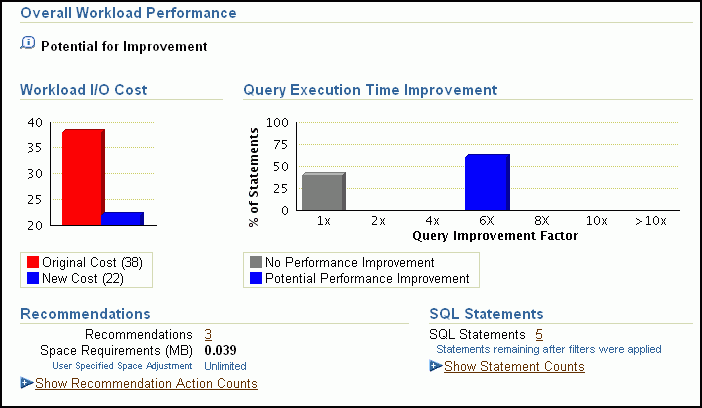
Description of the illustration sqlaccess_adv_results.gif
The Recommendations subpage shows the recommendations, if any, for improving performance. A recommendation might consist of, for example, a SQL script with one or more
CREATE INDEXstatements, which you can run by clicking Schedule Implementation.
Optimizing Memory Usage with the Memory Advisors
This section contains:
See Also:
About the Memory Advisors
Adequate physical memory has a significant impact on the performance of your Oracle Database. With its automatic memory management capabilities, Oracle Database can automatically adjust the memory distribution among the various SGA and PGA components for optimal performance. These adjustments are made within the boundaries of the total amount of memory that you allocate to the database.
ADDM periodically evaluates the performance of your database to determine performance problems. If ADDM finds that the current amount of available memory is inadequate and adversely affecting performance, then it can recommend that you increase memory allocations. You can select new memory allocations using the Memory Advisors.
Additionally, you can use the Memory Advisors to perform what-if analysis on the following:
-
The database performance benefits of adding physical memory to your database
-
The database performance impact of reducing the physical memory available to your database
With the Memory Advisors, you can obtain memory sizing advice as follows:
-
If automatic memory management is enabled, then you can get advice for setting the target amount of memory to allocate to the Oracle instance.
-
If automatic memory management is disabled and automatic shared memory management is enabled, then you can get advice on configuring the target sizes of the SGA and instance PGA.
-
If only manual shared memory management is enabled, then you can get advice on sizing the shared pool, buffer cache, and instance PGA.
Example: Obtaining Memory Sizing Advice for ASMM
The following steps describe how to obtain memory sizing advice when automatic shared memory management (ASMM) is enabled.
To obtain memory sizing advice for ASMM:
-
Go to the Database Home page.
-
At the bottom of the page, click Advisor Central.
-
On the Advisor Central page, click Memory Advisors.
The Memory Advisors page appears.
-
On the SGA subpage, next to the Total SGA Size field, click Advice.
The SGA Size Advice child page appears in a separate window.
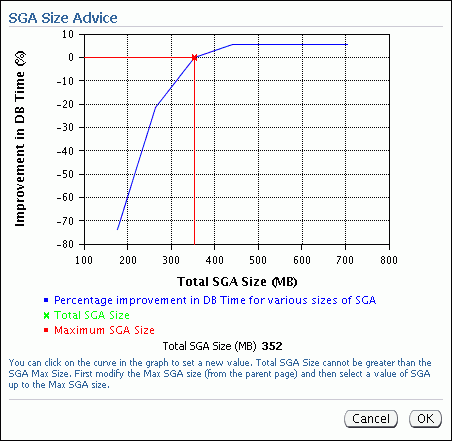
Description of the illustration sga-sizeadvice.gif
Improvement in DB Time (%) is plotted against Total SGA size. A higher number for Improvement in DB Time is better for performance. In this sample figure, the graph indicates that increasing the SGA size greater than 450 MB results in no performance gain. Thus, 450 MB is the recommended optimal SGA size.
Click OK to close the SGA Size Advice child page.
-
Near the top of the Memory Advisors page, click PGA to display the PGA subpage.
-
Next to Aggregate PGA Target, click Advice.
The PGA Target Advice page appears, plotting cache hit percentage against PGA target size.
The cache hit percentage is the percentage of read requests serviced by memory, as opposed to those requests serviced by reading from disk, which is slower. A higher hit percentage indicates better cache performance. The optimal zone for cache hit percentage is between 75 and 100 percent. However, it is not safe to conclude that your database is having performance problems simply because your cache hit percentage is not within the optimal zone. When the amount of currently available PGA memory is not adequate for optimal performance, ADDM automatically recommends adjusting this value in a performance finding.
Click OK to close the PGA Target Advice page.
See Also:
Monitoring and Tuning: Oracle By Example Series
Oracle By Example (OBE) has a series on the Oracle Database 2 Day DBA guide. This OBE steps you through the tasks in this section, and includes annotated screenshots.
To view the Monitoring OBE, in your browser, enter the following URL: