5 Administering an Oracle Streams Replication Environment
This chapter describes how to manage, monitor, and troubleshoot an Oracle Streams replication environment.
This chapter contains the following sections:
Note:
This document only covers some Oracle Streams administrative operations that you can perform in Oracle Enterprise Manager. See the Oracle Enterprise Manager online help for complete instructions.See Also:
Managing an Oracle Streams Replication Environment
An Oracle Streams replication environment should not require much management. If the environment is configured properly, then it should replicate changes to database objects automatically with minimal administration required. This section contains instructions for performing administrative tasks that might be required from time to time in an Oracle Streams replication environment.
The following topics describe managing an Oracle Streams replication environment:
See Also:
Managing Capture Processes
You can use Enterprise Manager to manage capture processes. This topic includes instructions for completing the most common management tasks for capture processes.
The following topics describe managing capture processes:
Starting and Stopping a Capture Process
This topic contains instructions for starting and stopping a capture process in Enterprise Manager.
A capture process might stop automatically if it encounters an error, such as an unsupported data type. When this happens, the error is displayed on the Capture subpage of the Manage Replication page in Enterprise Manager. In this case, you should correct the error and restart the capture process.
Also, it is important to remember that a capture process can capture changes that were made to database objects while the capture process was stopped. These changes are recorded in the redo log, and a capture process finds the changes that it is configured to capture in the redo log after it restarts. If you want to avoid capturing specific changes to database objects, then you should use tags to accomplish this. See "About Tags for Avoiding Change Cycling".
To start or stop a capture process:
-
In Oracle Enterprise Manager, log in to the database as the Oracle Streams administrator.
-
Go to the Database Home page.
-
Under High Availability, click the number link in Streams Components.
The Manage Replication page appears, showing the Overview subpage.
-
Click Streams to open the Streams subpage.
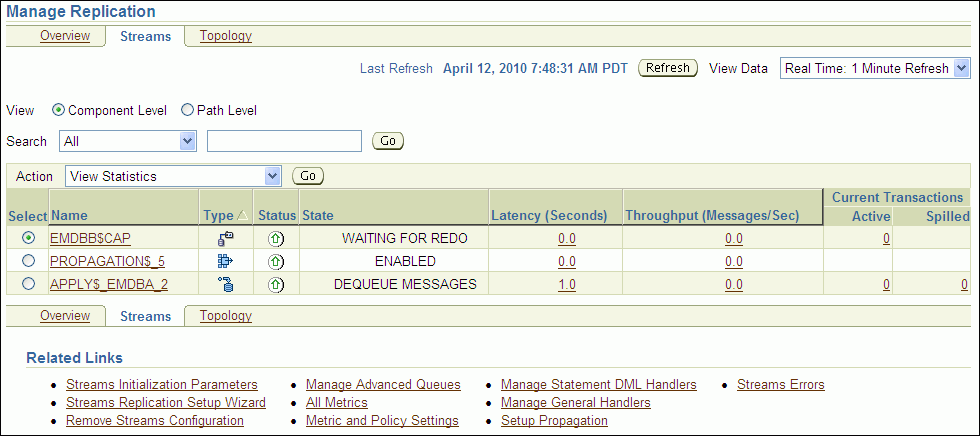
Description of the illustration tdpii_strrms_strms.gif
-
Select the capture process to start or stop in the list of components. If necessary, use the search tool to find the capture process, and then select it.
-
In the Action list, select Enable to start a disabled or aborted capture process, or select Disable to stop an enabled capture process.
-
Click Go.
-
If you are disabling the capture process, then click Yes on the confirmation page to finish disabling it.
Note:
You can also use theSTART_CAPTURE procedure and STOP_CAPTURE procedure in the DBMS_CAPTURE_ADM package to start and stop a capture process.Setting a Capture Process Parameter
This topic contains instructions for setting capture process parameters in Enterprise Manager. Capture process parameters control the way a capture process operates. You can set a parameter to change a specific way in which a capture process operates. For example, you can change the parallelism capture process parameter to control the number of processes that capture changes. Typically, you adjust capture process parallelism to achieve the best capture process performance.
To set a capture process parameter:
-
In Oracle Enterprise Manager, log in to the database as the Oracle Streams administrator.
-
Go to the Database Home page.
-
Under High Availability, click the number link in Streams Components.
The Manage Replication page appears, showing the Overview subpage.
-
Click Streams to open the Streams subpage.

Description of the illustration tdpii_strrms_strms.gif
-
Select the capture process to modify in the list of components. If necessary, use the search tool to find the capture process, and then select it.
-
Select Configurations in Action.
-
Click Go to open the Configurations subpage.
-
Click Edit to open the Edit Capture Configuration page.
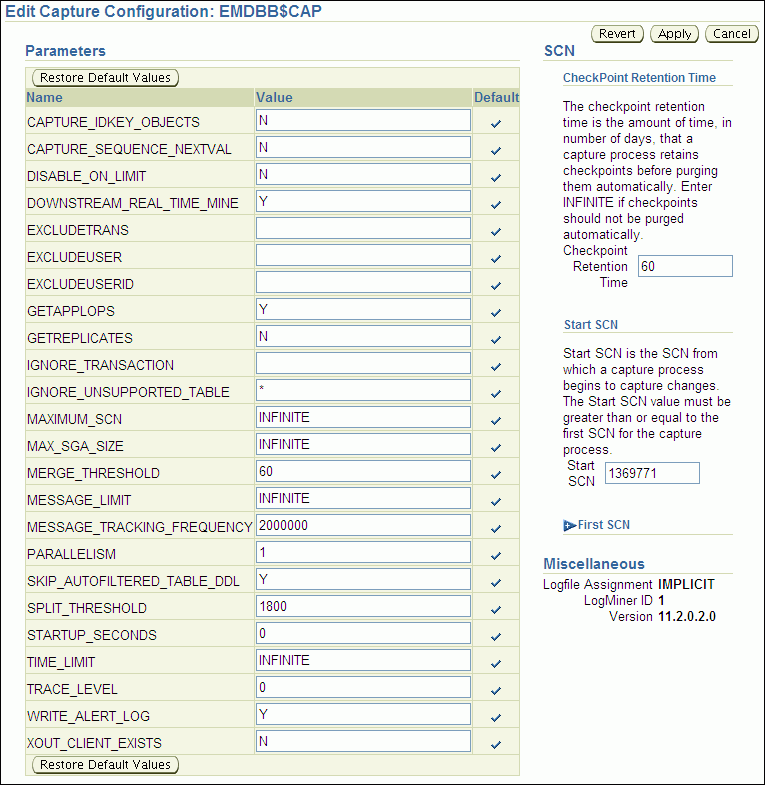
Description of the illustration tdpii_edit_capture.gif
-
Modify one or more capture process parameters in the Parameters section.
See Oracle Database PL/SQL Packages and Types Reference for information about the parameters. If you change the
parallelismparameter, then the capture process automatically stops and restarts when you click Apply. -
Click Apply to save your changes.
Note:
You can also use theDBMS_CAPTURE_ADM.SET_PARAMETER procedure to set a capture process parameter.Enabling and Disabling a Propagation
This topic contains instructions for enabling or disabling a propagation in Enterprise Manager.
You might need to disable a propagation if the database to which the propagation sends messages goes down or if a network problem prevents the propagation from sending messages. In these situations, you can disable the propagation and enable it when the problem is corrected.
Also, a propagation is aborted automatically after it fails to send messages in 16 consecutive attempts. When this happens, the error is displayed on the Propagation subpage of the Manage Replication page in Enterprise Manager. In this case, you should correct the error and enable the propagation.
To enable or disable a propagation:
-
In Oracle Enterprise Manager, log in to the database as the Oracle Streams administrator.
-
Go to the Database Home page.
-
Under High Availability, click the number link in Streams Components.
The Manage Replication page appears, showing the Overview subpage.
-
Click Streams to open the Streams subpage.

Description of the illustration tdpii_strrms_strms.gif
-
Select the propagation to enable or disable in the list of components. If necessary, use the search tool to find the propagation, and then select it.
-
In the Action list, select Enable to start a disabled or aborted propagation, or select Disable to stop an enabled propagation.
-
Click Go.
Note:
You can also use theSTART_PROPAGATION procedure and STOP_PROPAGATION procedure in the DBMS_PROPAGATION_ADM package to start and stop a propagation.See Also:
-
Oracle Streams Advanced Queuing User's Guide for more information about managing propagations and propagation schedules
Managing Apply Processes
You can use Enterprise Manager to manage apply processes. This section includes instructions for completing the most common management tasks for apply processes.
The following topics describe managing apply processes:
Starting and Stopping an Apply Process
This topic contains instructions for starting and stopping an apply process in Enterprise Manager.
An apply process might stop automatically if it encounters an error, such as attempting to update a row that does not exist in a table. When this happens, the status of the apply process is ABORTED on the Apply subpage of the Manage Replication page in Enterprise Manager. In this case, you should correct the error and restart the apply process.
To start or stop an apply process:
-
In Oracle Enterprise Manager, log in to the database as the Oracle Streams administrator.
-
Go to the Database Home page.
-
Under High Availability, click the number link in Streams Components.
The Manage Replication page appears, showing the Overview subpage.
-
Click Streams to open the Streams subpage.

Description of the illustration tdpii_strrms_strms.gif
-
Select the apply process to start or stop in the list of components. If necessary, use the search tool to find the apply process, and then select it.
-
In the Action list, select Enable to start a disabled or aborted apply process, or select Disable to stop an enabled apply process.
-
Click Go.
-
If you are disabling the apply process, then click Yes on the confirmation page to finish disabling it.
Note:
You can also use theSTART_APPLY procedure and STOP_APPLY procedure in the DBMS_APPLY_ADM package to start and stop an apply process.Setting an Apply Process Parameter
This topic contains instructions for setting apply process parameters in Enterprise Manager. Apply process parameters control the way an apply process operates. You can set a parameter to change a specific way in which an apply process operates. For example, you can change the parallelism apply process parameter to control the number of processes that apply changes. Typically, you adjust apply process parallelism to achieve the best apply process performance.
To set an apply process parameter:
-
In Oracle Enterprise Manager, log in to the database as the Oracle Streams administrator.
-
Go to the Database Home page.
-
Under High Availability, click the number link in Streams Components.
The Manage Replication page appears, showing the Overview subpage.
-
Click Streams to open the Streams subpage.

Description of the illustration tdpii_strrms_strms.gif
-
Select the apply process to modify in the list of components. If necessary, use the search tool to find the apply process, and then select it.
-
Select Configurations in Action.
-
Click Go to open the Configurations subpage.
-
Click Edit to open the Edit Apply Configuration page.
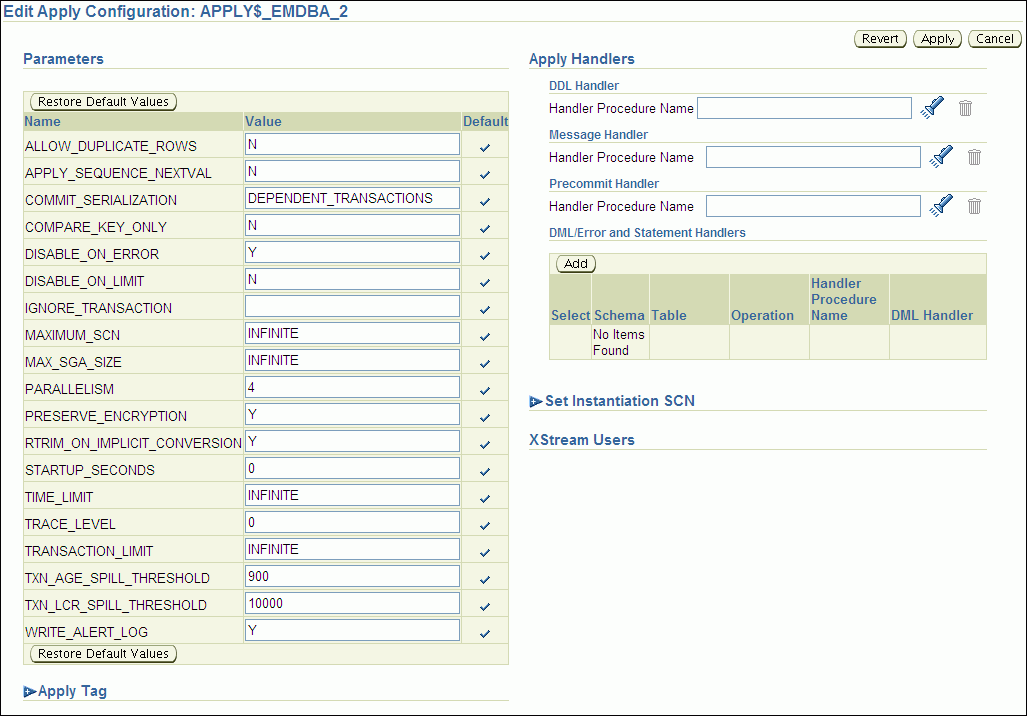
Description of the illustration tdpii_edit_apply.gif
-
Modify one or more apply process parameters in the Parameters section.
See Oracle Database PL/SQL Packages and Types Reference for information about the parameters. If you change the
parallelismparameter, then the apply process automatically stops and restarts when you click Apply. -
Click Apply to save your changes.
Note:
You can also use theDBMS_APPLY_ADM.SET_PARAMETER procedure to set an apply process parameter.Monitoring an Oracle Streams Replication Environment
This section describes using Enterprise Manager and SQL*Plus to display general information about replication components and the replication topology. It also contains instructions for monitoring capture processes, propagations, and apply processes.
The following topics describe monitoring an Oracle Streams replication environment:
-
Displaying an Overview of the Replication Components at a Database
-
Displaying Performance Analysis Information for Oracle Streams Components
-
Displaying the Topology of the Oracle Streams Environment at a Database
See Also:
Displaying an Overview of the Replication Components at a Database
The Overview subpage of the Manage Replication page in Enterprise Manager contains information about the Oracle Streams components in the current database. This information includes:
-
General information about the Streams pool size
-
The number of capture processes, propagations, and apply processes in the local database
-
The number of capture processes, propagations, and apply processes that currently have errors
-
A summary of the Stream paths that flow through the Oracle Streams components at the local database
-
Graphs that show the latency and throughput for capture processes, propagations, and apply processes
You can click a number to drill down to more information about a component or to manage a component.
To display an overview of the replication components at a database:
-
In Oracle Enterprise Manager, log in to the database as the Oracle Streams administrator.
-
Go to the Database Home page.
-
Under High Availability, click the number link in Streams Components.
The Manage Replication page appears, showing the Overview subpage.
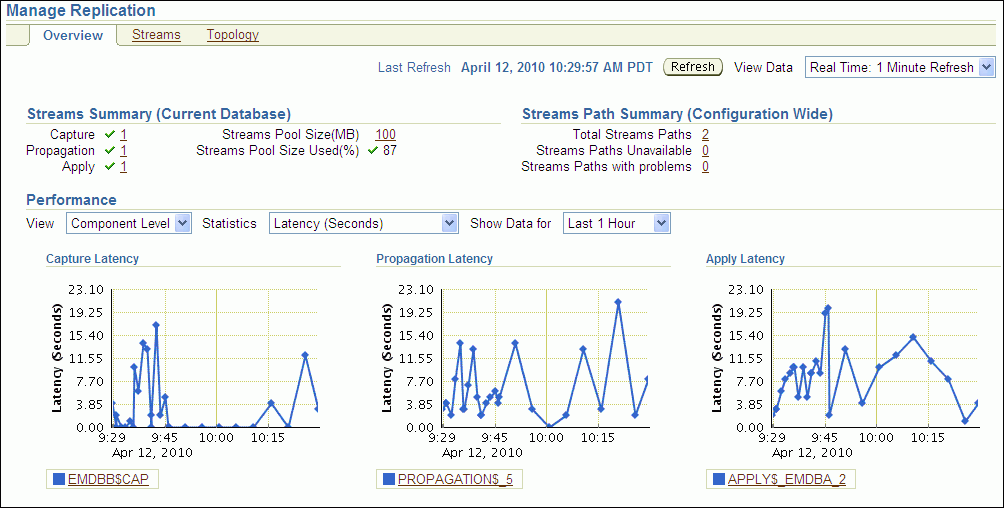
Description of the illustration tdpii_streams_main1.gif
Displaying the Stream Paths
Oracle Enterprise Manager uses the Oracle Streams Performance Advisor to track the stream paths for the Oracle Streams components in a database. The Oracle Streams components include capture processes, queues, propagation senders, propagation receivers, and apply processes. The Oracle Streams Performance Advisor enables you to monitor these components are performing. The Oracle Streams Performance Advisor also tracks the links between the components, and the way information flows from capture to consumption.
A stream path is a flow of messages from a source to a destination. A stream path begins where a capture process, synchronous capture, or application enqueues messages into a queue. A stream path ends where an apply process dequeues the messages. The stream path might flow through multiple queues and propagations before it reaches the apply process. Therefore, a single stream path can consist of multiple source/destination component pairs before it reaches the apply process.
To display a stream paths for the Oracle Streams components in a database:
-
In Oracle Enterprise Manager, log in to the database as the Oracle Streams administrator.
-
Go to the Database Home page.
-
Under High Availability, click the number link in Streams Components.
The Manage Replication page appears, showing the Overview subpage.
-
Click Streams to open the Streams subpage.
-
Select the Path Level option in View.
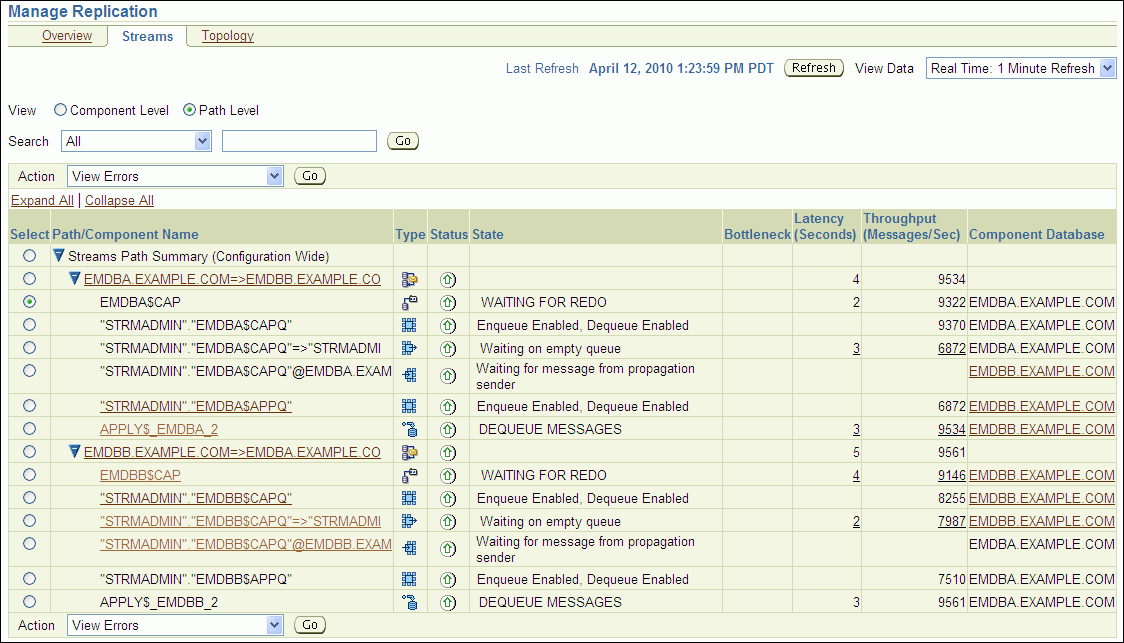
Description of the illustration tdpii_streams_paths.gif
Oracle Streams Concepts and Administration contains detailed information about stream paths. You can click the link for a statistic for detailed information about the statistic.
Also, the path level view shows if any components are bottleneck components. A bottleneck component is the busiest component or the component with the least amount of idle time. If there are bottleneck components, then check the status of these components. If they are disabled, then you can enable them. If these components are enabled, then you can examine the components to see if they can be modified to perform better.
Note:
In Database Control, links are not available for statistics that are for components that run on a remote database.Displaying Performance Analysis Information for Oracle Streams Components
Oracle Enterprise Manager uses the Oracle Streams Performance Advisor to monitor the performance of the Oracle Streams components in a database.
To display performance analysis information for the Oracle Streams components in a database:
-
Log in to Enterprise Manager as an administrative user, such as the Oracle Streams administrator.
-
Go to the Database Home page of the database you want to manage.
-
Click Advisor Central in the Related Links section.
-
On the Advisor Central page, click Streams Performance Advisor.
The Streams Performance Advisor page displays a summary of the performance analysis information for each component.
-
To view detailed performance analysis information, choose an option:
-
To view detailed performance analysis information for all components, click View All Details.
-
To view detailed performance analysis information about a component, select the component and click View Details.
-
Oracle Streams Concepts and Administration contains detailed information about the component types and statistics shown on these pages.
Displaying the Topology of the Oracle Streams Environment at a Database
An Oracle Streams topology displays a graphical representation of the local database and other databases that interact with the local database in the Oracle Streams environment. In a replication environment, the topology shows the following information about the databases displayed:
-
The database links used by propagations from the current database to other databases in the Oracle Streams environment. Each arrow that originates at the current database shows a database link used by a propagation from the current database to another database. Replication environments use database links to send changes made to replicated objects to other databases.
-
The database links used by propagations from other databases in the Oracle Streams environment to the current database for which an apply process at the current database applies the propagated messages. Each arrow that terminates at the current database shows a database link used by a propagation from another database to the current database whose messages are applied at the current database.
To view the Oracle Streams topology:
-
In Oracle Enterprise Manager, log in to the database as the Oracle Streams administrator.
-
Go to the Database Home page.
-
Under High Availability, click the number link in Streams Components.
The Manage Replication page appears, showing the Overview subpage.
-
Click Topology to open the Topology subpage.
You can use the Overview window to select a particular portion of the topology to view in detail and to zoom in and zoom out. You can also select a database in the topology and view the Selection Details window for information about the database.
Click the Legend link for more information about the Oracle Streams topology.
The following graphic shows an example of the Oracle Streams topology for an Oracle Streams replication environment:
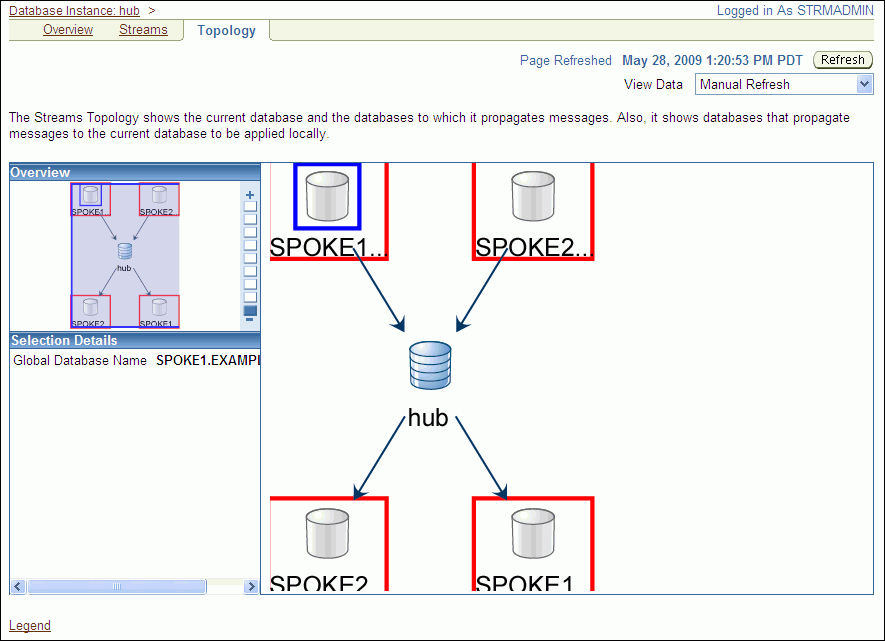
Description of the illustration tdpii_streams_topology.gif
The Oracle Streams topology in the previous figure shows a hub-and-spoke replication configuration. The configuration includes the following elements:
-
The current database is named
hub. -
The
spoke1.example.comdatabase is part of the replication environment that interacts with the current database. There is a database link from this database to the hub database and from the hub database to this database. -
The
spoke2.example.comdatabase is part of the replication environment that interacts with the current database. There is a database link from this database to the hub database and from the hub database to this database.
Monitoring Capture Processes
You can use Enterprise Manager to view detailed information about capture processes. You can also view statistics for capture processes.
The following topics describe monitoring capture processes:
Viewing Information About a Capture Process
You can use Enterprise Manager to view information about a capture process. This information includes the capture process status and state and other information about the capture process.
To view detailed information about a capture process in Enterprise Manager:
-
In Oracle Enterprise Manager, log in to the database as the Oracle Streams administrator.
-
Go to the Database Home page.
-
Under High Availability, click the number link in Streams Components.
The Manage Replication page appears, showing the Overview subpage.
-
Click Streams to open the Streams subpage.

Description of the illustration tdpii_strrms_strms.gif
The Steams subpage shows general information about each capture process in the database. This information includes capture process status, state, latency, and throughput.
-
Select the capture process to monitor in the list of components. If necessary, use the search tool to find the capture process, and then select it.
-
Select View Details in Action.
-
Click Go to open the View Capture Details page.
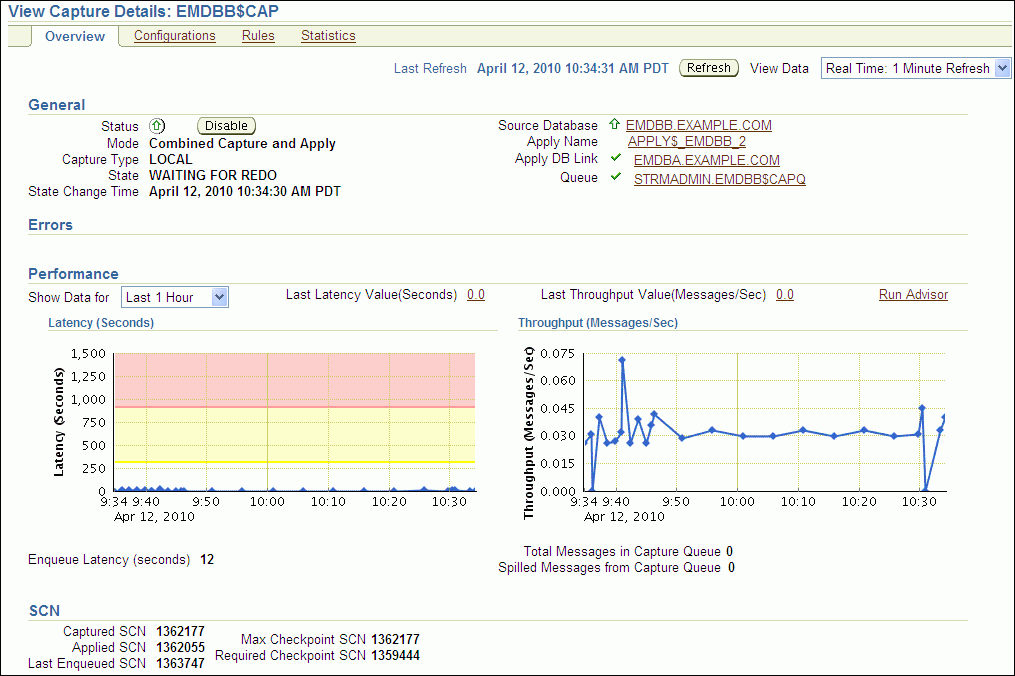
Description of the illustration tdpii_view_capture_details.gif
The View Capture Details page includes detailed information about the capture process.
Note:
You can also query theALL_CAPTURE and V$STREAMS_CAPTURE data dictionary views for information about a capture process.Viewing Statistics for a Capture Process
You can use Enterprise Manager to view statistics for a capture process. The statistics include the number of messages in the capture process's queue, the number of messages captured and enqueued by the capture process, and other statistics relating to the capture process.
To view statistics for a capture process in Enterprise Manager:
-
In Oracle Enterprise Manager, log in to the database as the Oracle Streams administrator.
-
Go to the Database Home page.
-
Under High Availability, click the number link in Streams Components.
The Manage Replication page appears, showing the Overview subpage.
-
Click Streams to open the Streams subpage.

Description of the illustration tdpii_strrms_strms.gif
The Streams subpage shows general information about each capture process in the database. This information includes capture process status, state, latency, and throughput.
-
Select the capture process to monitor in the list of components. If necessary, use the search tool to find the capture process, and then select it.
-
Select View Statistics in Action.
-
Click Go to open the View Capture Statistics page.
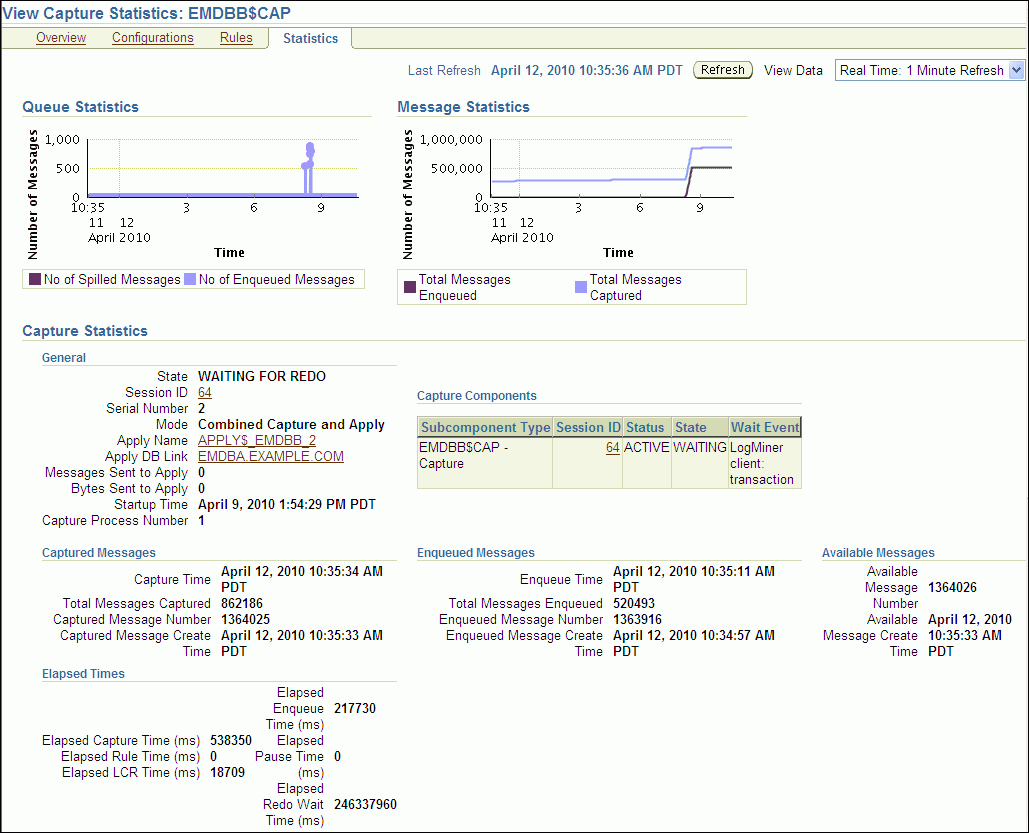
Description of the illustration tdpii_view_capture_stats.gif
The View Capture Statistics page includes the following information:
-
The Queue Statistics graph shows the number of messages currently in the capture process's queue. The No of Enqueued Messages line in the graph shows the total number of messages currently in the buffered queue. The No of Spilled Messages line in the graph shows the total number of messages that have spilled from memory into the persistent queue table.
-
The Message Statistics graph shows the total number of changes enqueued and captured by the capture process since it last started. Total Messages Enqueued shows the number of changes enqueued by the capture process. Total Messages Captured shows the number of changes that were evaluated in detail against the capture process rules. If a change does not satisfy the capture process rules, then the change is not enqueued.
-
The Capture Statistics section includes the current state of the capture process, and statistics related to time and changes (messages) captured. See the documentation for the
V$STREAMS_CAPTUREdynamic performance view in Oracle Database Reference for more information about these statistics.
Viewing Active Capture Process Transactions
You can use Enterprise Manager to view the transactions that are currently being processed by a capture process. Enterprise Manager displays the following information:
-
Transaction ID: The transaction ID of each transaction
-
Cumulative Messages: The cumulative number of messages in the transaction
In an Oracle Streams replication environment, each message is a logical change record (LCR). If the Streams process is restarted while the transaction changes are being captured, then this column shows the number of LCRs captured in the transaction since the Streams process was started.
-
First SCN: The system change number (SCN) for the first message in the transaction
-
Last SCN: The SCN for the last message in the transaction
-
Active Since: The time when the first message in the transaction was recorded
In an Oracle Streams replication environment, changes captured by a capture process are recorded in the database redo log.
-
Active For (Seconds): The amount of time that the transaction in the stream, which is the amount of time between the Active Since time and the current time
To view the active capture process transactions:
-
In Oracle Enterprise Manager, log in to the database as the Oracle Streams administrator.
-
Go to the Database Home page.
-
Under High Availability, click the number link in Streams Components.
The Manage Replication page appears, showing the Overview subpage.
-
Click Streams to open the Streams subpage.

Description of the illustration tdpii_strrms_strms.gif
The Capture subpage shows general information about each capture process in the database. This information includes capture process status, state, latency, and throughput.
-
Click the number link in the Current Transactions Active field for the capture process to open the View Capture Statistics page.
The Active Streams Transactions List section displays the active capture process transactions.

Description of the illustration tdpii_active_cap_trans.gif
The Session ID and Total Messages fields do not apply to capture processes.
-
To drill-down for more information about a transaction, select the transaction and click View Transaction Details.
-
On the LogMiner page, click Continue.
-
On the LogMiner Results page, click the Transaction ID link in the table in the Transaction Results section.
The Transaction Details page displays detailed information about the changes in the transaction.

Description of the illustration tdpii_cap_trans_detailes.gif
Monitoring Propagations
You can use Enterprise Manager to view detailed information about propagations. You can also view statistics for propagations.
The following topics describe monitoring propagations:
Viewing Information About a Propagation
You can use Enterprise Manager to view information about a propagation. This information includes the propagation status, whether the propagation has failed, and other information about the propagation.
To view information about a propagation in Enterprise Manager:
-
In Oracle Enterprise Manager, log in to the database as the Oracle Streams administrator.
-
Go to the Database Home page.
-
Under High Availability, click the number link in Streams Components.
The Manage Replication page appears, showing the Overview subpage.
-
Click Streams to open the Streams subpage.

Description of the illustration tdpii_strrms_strms.gif
-
Select the propagation to monitor in the list of components. If necessary, use the search tool to find the propagation, and then select it.
-
Select View Details in Action.
-
Click Go to open the View Propagation Details page.
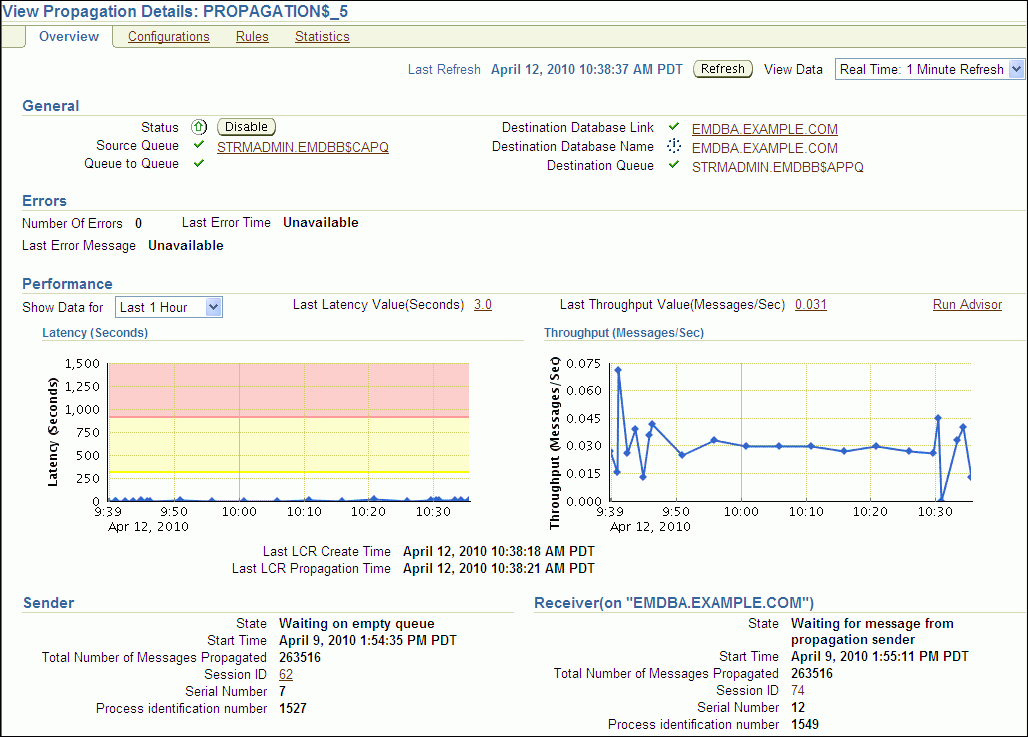
Description of the illustration tdpii_view_prop_details.gif
The View Propagation Details page includes detailed information about the propagation.
Note:
You can also query the following data dictionary views for information about a propagation:Viewing Statistics for a Propagation
You can use Enterprise Manager to view statistics for a propagation. The statistics include the number of messages in the propagation source queue, the number of messages sent by the propagation, and other statistics relating to the propagation.
To view statistics for a propagation in Enterprise Manager:
-
In Oracle Enterprise Manager, log in to the database as the Oracle Streams administrator.
-
Go to the Database Home page.
-
Under High Availability, click the number link in Streams Components.
The Manage Replication page appears, showing the Overview subpage.
-
Click Streams to open the Streams subpage.

Description of the illustration tdpii_strrms_strms.gif
-
Select the propagation to monitor in the list of components. If necessary, use the search tool to find the propagation, and then select it.
-
Select View Statistics in Action.
-
Click Go to open the View Propagation Statistics page.
The View Propagation Statistics page includes the following subpages:
-
The Buffered Queue option shows propagation statistics for messages that were enqueued into the buffered queue portion of the queue used by the propagation. Use this subpage to view propagation statistics if the propagation sends changes captured by a capture process.
-
The Persistent Queue option shows propagation statistics for messages that were enqueued into the persistent queue portion of the queue used by the propagation. Use this subpage to view propagation statistics if the propagation sends changes captured by a synchronous capture.
Both options contain graphs that show the number of messages in the queue and the number of messages sent by the propagation over several hours. Both options also contain other propagation statistics, such as the total number of messages and bytes propagated since the propagation was last started.
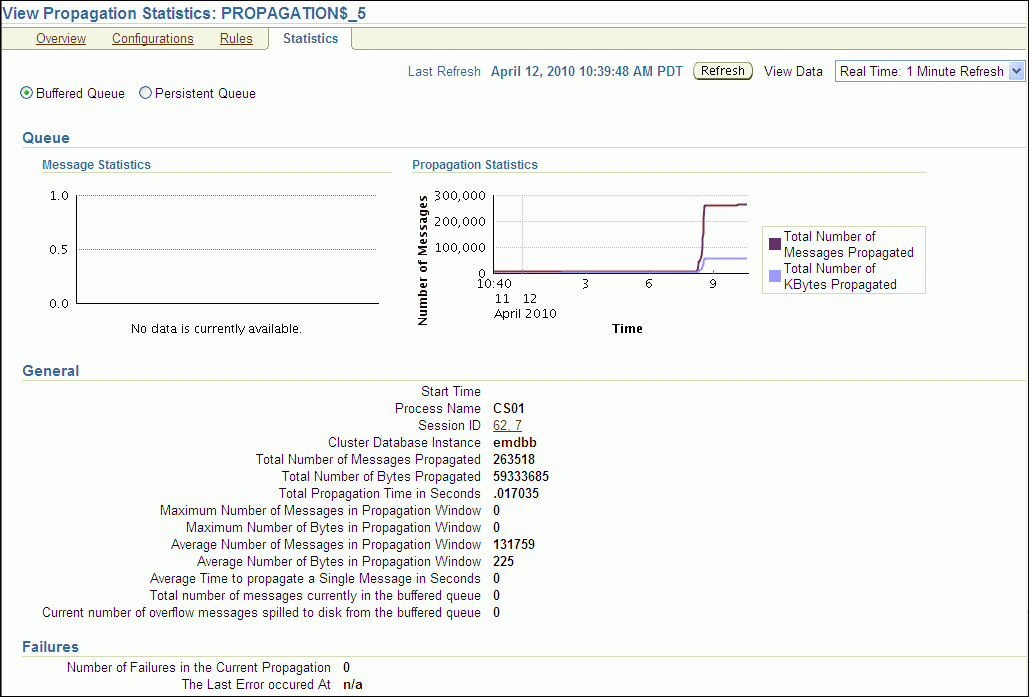
Description of the illustration tdpii_prop_stats.gif
Note:
You can also query the following dynamic performance views for buffered queue statistics and propagation statistics:Monitoring Apply Processes
You can use Enterprise Manager to view detailed information about apply processes. You can also view statistics for apply processes.
The following topics describe monitoring apply processes:
Viewing Information About an Apply Process
You can use Enterprise Manager to view information about an apply process. This information includes the apply process status and state and other information about the apply process.
To view information about an apply process in Enterprise Manager:
-
In Oracle Enterprise Manager, log in to the database as the Oracle Streams administrator.
-
Go to the Database Home page.
-
Under High Availability, click the number link in Streams Components.
The Manage Replication page appears, showing the Overview subpage.
-
Click Streams to open the Streams subpage.

Description of the illustration tdpii_strrms_strms.gif
-
Select the apply process to monitor in the list of components. If necessary, use the search tool to find the apply process, and then select it.
-
Select View Details in Action.
-
Click Go to open the View Apply Details page.
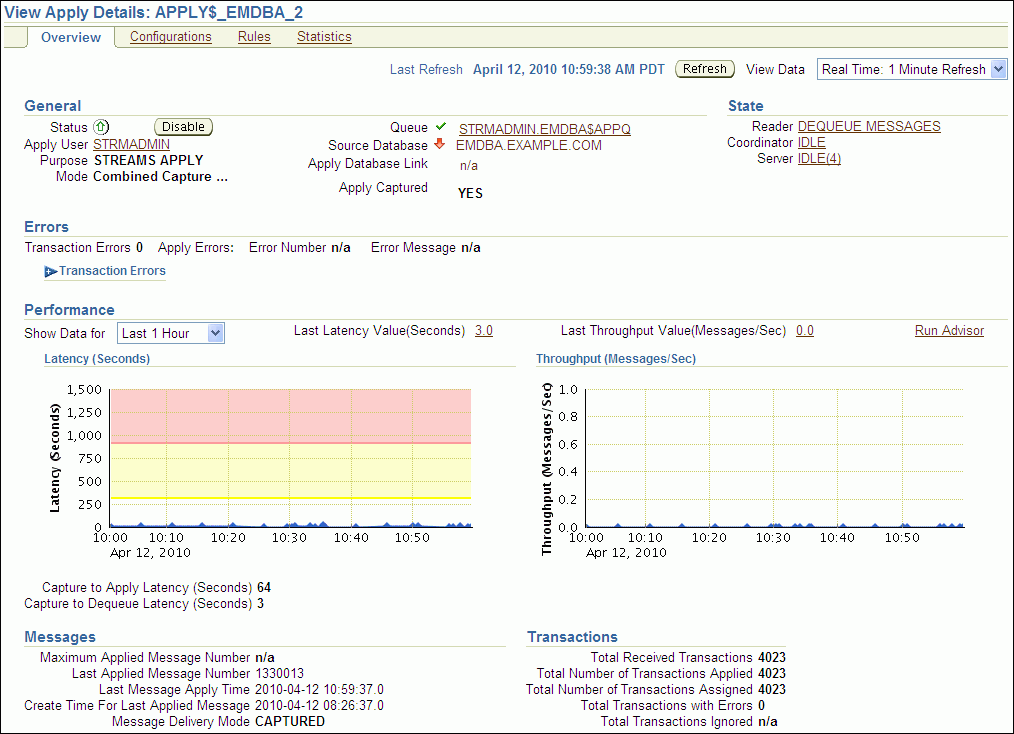
Description of the illustration tdpii_view_apply_details.gif
The View Apply Details page includes detailed information about the apply process.
Note:
You can also query the following data dictionary views for information about an apply process:Viewing Statistics for an Apply Process
You can use Enterprise Manager to view statistics for an apply process. The statistics include the number of messages in the apply process's queue, the number of messages applied by the apply process, and other statistics relating to the apply process.
To view statistics for an apply process in Enterprise Manager:
-
In Oracle Enterprise Manager, log in to the database as the Oracle Streams administrator.
-
Go to the Database Home page.
-
Under High Availability, click the number link in Streams Components.
The Manage Replication page appears, showing the Overview subpage.
-
Click Streams to open the Streams subpage.

Description of the illustration tdpii_strrms_strms.gif
-
Select the apply process to monitor in the list of components. If necessary, use the search tool to find the apply process, and then select it.
-
Select View Statistics in Action.
-
Click Go to open the View Apply Statistics page.
The View Apply Statistics page includes the following subpages:
-
The Queue subpage shows the number of messages over the past several hours in both the persistent queue portion and the buffered queue portion of the apply process's queue. If the apply process applies changes captured by a synchronous capture, then analyze the persistent queue statistics. If the apply process applies changes captured by a capture process, then analyze the buffered queue statistics.
-
The Reader subpage shows statistics for the reader server. The reader server dequeues messages from the apply process's queue and assembles them into separate transactions.
-
The Coordinator subpage shows statistics for the coordinator process. The coordinator process gets transactions from the reader server and passes them to apply servers.
-
The Server subpage shows statistics for the apply servers. The apply servers apply changes to database objects or pass the changes to apply handlers. To view details about a specific apply server, select it and click View Details.
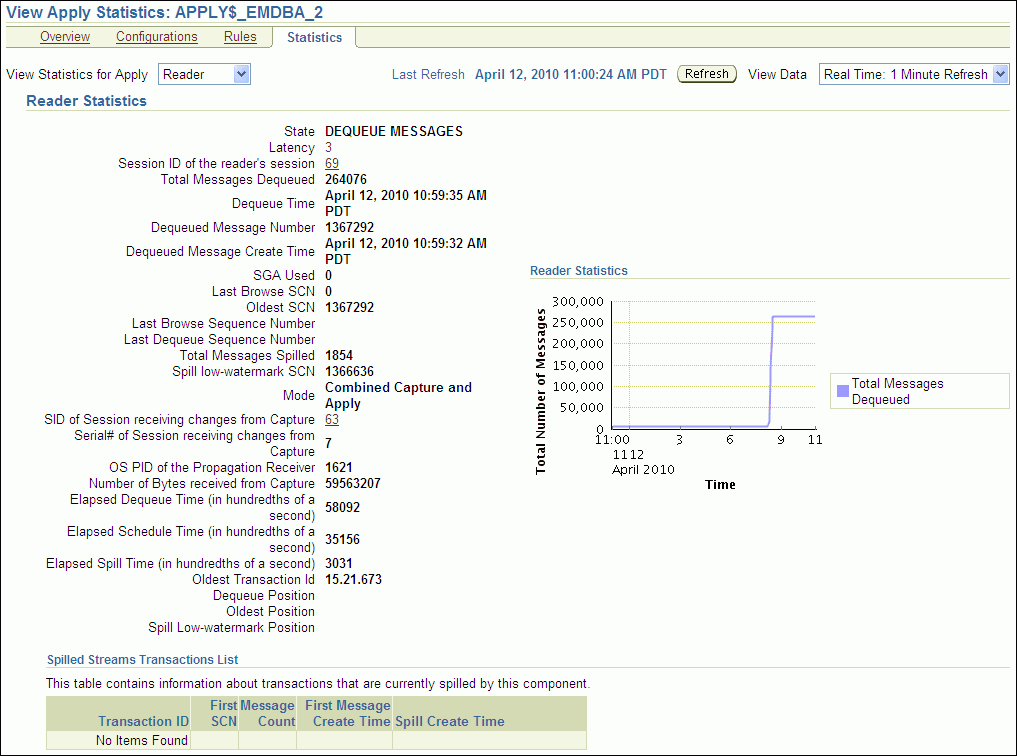
Description of the illustration tdpii_apply_co_stats.gif
Note:
You can also query the following dynamic performance views for buffered queue statistics and apply process statistics:Viewing Active and Spilled Apply Process Transactions
You can use Enterprise Manager to view the transactions that are currently being processed by an apply process. Active transactions are transactions with messages that are currently in the buffered queue for the apply process. Spilled transactions are transactions with messages that have spilled from the buffered queue to the hard disk.
Enterprise Manager displays the following information for active transactions:
-
Transaction ID: The transaction ID of each transaction
-
Session ID: The session ID of the apply process's coordinator process
-
Total Messages: The total number of messages in the transaction
The total number of messages in the transaction is calculated only for apply processes. In an Oracle Streams replication environment, each message is a logical change record (LCR).
-
Cumulative Messages: The cumulative number of messages in the transaction
If the Streams process is restarted while the transaction is being received, then this column shows the number of LCRs received in the transaction since the Streams process was started.
-
First SCN: The system change number (SCN) of the first message in the transaction
-
Last SCN: The SCN of the last message in the transaction
-
Active Since: The time when the first message in the transaction was recorded
In an Oracle Streams replication environment, changes captured by a capture process are recorded in the database redo log.
-
Active For (Seconds): The amount of time that the transaction in the stream, which is the amount of time between the Active Since time and the current time
Enterprise Manager displays the following information for spilled transactions:
-
Transaction ID: The transaction ID of each transaction
-
Session ID: The session ID of the apply process's reader server
-
First SCN: The SCN for the first message in the transaction
-
Message Count: The number of spilled messages in the transaction
In an Oracle Streams replication environment, each message is a logical change record (LCR).
-
First Message Create Time: The time when the first message in the transaction was recorded
In an Oracle Streams replication environment, changes captured by a capture process are recorded in the database redo log.
-
Spill Create Time: The time when the first message in the transaction spilled from the buffered queue to the hard disk (spill create time)
To view active and spilled apply process transactions:
-
In Oracle Enterprise Manager, log in to the database as the Oracle Streams administrator.
-
Go to the Database Home page.
-
Under High Availability, click the number link in Streams Components.
The Manage Replication page appears, showing the Overview subpage.
-
Click Streams to open the Streams subpage.

Description of the illustration tdpii_strrms_strms.gif
-
Perform one of the following actions:
-
To view the active apply process transactions, click the number link in the Current Transactions Active field for the apply process.
The Active Streams Transactions List section on the View Apply Statistics page displays the active apply process transactions.

Description of the illustration tdpii_active_app_trans.gif
-
To view the spilled apply process transactions, click the number link in the Current Transactions Spilled field for the apply process.
The Spilled Streams Transactions List section on the View Apply Statistics page displays the spilled apply process transactions.

Description of the illustration tdpii_spilled_app_trans.gif
-
Displaying the Configured Update Conflict Handlers
In a replication environment, update conflict handlers automatically resolve conflicts that occur when the same row is updated at two different databases at nearly the same time. You can use the ALL_APPLY_CONFLICT_COLUMNS data dictionary view to list the update conflict handlers.
To display the configured update conflict handlers:
-
Open SQL*Plus and connect to the database as the Oracle Streams administrator.
See Oracle Database 2 Day DBA for more information about starting SQL*Plus.
-
Run the following query:
COLUMN OBJECT_OWNER HEADING 'Table|Owner' FORMAT A5
COLUMN OBJECT_NAME HEADING 'Table Name' FORMAT A12
COLUMN METHOD_NAME HEADING 'Method' FORMAT A12
COLUMN RESOLUTION_COLUMN HEADING 'Resolution|Column' FORMAT A13
COLUMN COLUMN_NAME HEADING 'Column Name' FORMAT A30

SELECT OBJECT_OWNER,
       OBJECT_NAME,
       METHOD_NAME,
       RESOLUTION_COLUMN,
       COLUMN_NAME
  FROM ALL_APPLY_CONFLICT_COLUMNS
  ORDER BY OBJECT_OWNER, OBJECT_NAME, RESOLUTION_COLUMN;
The output will be similar to the following:
Table                           Resolution
Owner Table Name   Method       Column        Column Name
----- ------------ ------------ ------------- ------------------------------
HR    COUNTRIES    MAXIMUM      TIME          TIME
HR    COUNTRIES    MAXIMUM      TIME          REGION_ID
HR    COUNTRIES    MAXIMUM      TIME          COUNTRY_NAME
HR    DEPARTMENTS  MAXIMUM      TIME          TIME
HR    DEPARTMENTS  MAXIMUM      TIME          MANAGER_ID
HR    DEPARTMENTS  MAXIMUM      TIME          LOCATION_ID
HR    DEPARTMENTS  MAXIMUM      TIME          DEPARTMENT_NAME
The output in this example shows that latest time conflict resolution is configured for the
hr.countriesandhr.departmentstables. When a conflict occurs for any column listed underColumnName, the change with the maximum, or latest, time in theTIMEresolution column is used, and the other change is discarded.
Viewing Buffered Queue Statistics
You can use Enterprise Manager to view statistics for a buffered queue that is used by a capture process, propagation, or apply process in your replication environment. In an Oracle Streams replication environment that uses capture processes to capture changes, each capture process enqueues changes into the buffered queue portion of its queue. The changes remain in buffered queues as they are propagated from one queue to another, and apply processes dequeue the changes from a buffered queue.
To view buffered queue statistics:
-
In Oracle Enterprise Manager, log in to the database as the Oracle Streams administrator.
-
Go to the Database Home page.
-
Click Data Movement to open the Data Movement subpage.
-
Click Manage Advanced Queues in the Streams section.
The Manage Advanced Queues page appears.
-
Select the queue to monitor. If necessary, use the search tool to find the queue, and then select it.
-
Select Queue Statistics in the Actions list.
-
Click Go to open the Queue Statistics page.
-
Click Buffered Queue Statistics to open the Buffered Queue Statistics subpage.
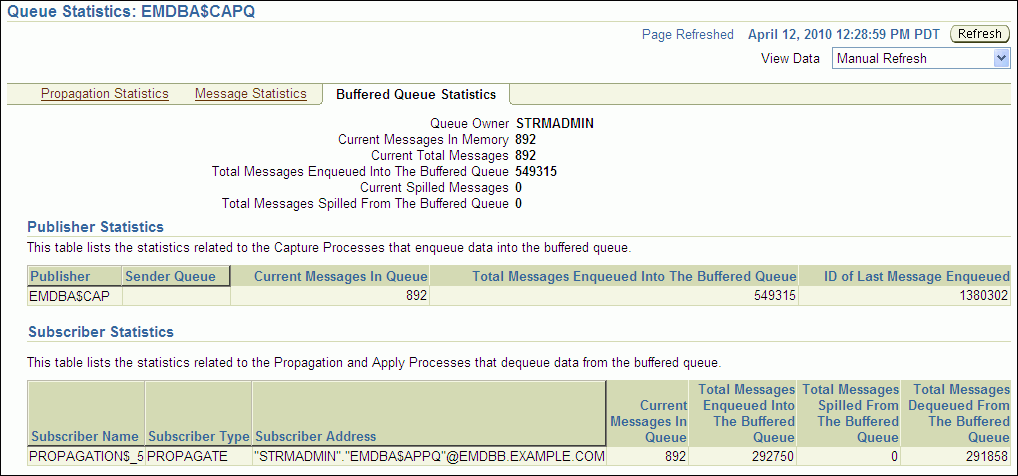
Description of the illustration tdpii_buf_q_stats.gif
This Buffered Queue Statistics subpage includes the following information about the buffered queue portion of the selected queue:
-
Information about the number of changes in the queue and the number of changes that have spilled from memory onto disk.
-
The number of changes enqueued by local capture processes. When the capture process is local, the Sender Queue field is empty.
-
The number of changes captured by remote capture processes at a different database and sent to the buffered queue. When a capture process is remote, the Sender Queue field contains the queue and database from which the changes were sent.
-
The number of changes dequeued by local apply processes from the buffered queue.
-
The number of changes sent by propagations from the buffered queue to a different queue.
Note:
You can also query the following dynamic performance views for buffered queue statistics:Troubleshooting an Oracle Streams Replication Environment
This section describes the most common problems in an Oracle Streams replication environment. It also describes how to correct these problems.
The following topics describe troubleshooting an Oracle Streams replication environment:
See Also:
-
Chapter 5, "Administering an Oracle Streams Replication Environment"
-
Oracle Streams Concepts and Administration for more information about troubleshooting Oracle Streams
Responding to Automated Alerts in Enterprise Manager
An alert is a warning about a potential problem or an indication that a critical threshold has been crossed. There are two types of alerts:
-
Stateless: Alerts that indicate single events that are not necessarily tied to the system state. For example, an alert that indicates that a capture aborted with a specific error is a stateless alert.
-
Stateful: Alerts that are associated with a specific system state. Stateful alerts are usually based on a numeric value, with thresholds defined at warning and critical levels. For example, an alert on the current Oracle Streams pool memory usage percentage, with the warning level at 85% and the critical level at 95%, is a stateful alert.
To view the alerts for a database:
-
Log in to Enterprise Manager as an administrative user, such as the Oracle Streams administrator.
-
Go to the Database Home page of the database you want to manage.
-
View the alerts for the database in the Alerts section. An Oracle Streams summary is also available in the High Availability section. You might need to scroll down to see these sections.
Oracle Streams has its own set of alerts. Table 5-1 describes the alerts related to Oracle Streams.
Table 5-1 Oracle Streams Alerts
| Alert | Message | Alert Type |
|---|---|---|
|
STREAMS capture process capture_name aborted with ORA-error_number |
Stateless |
|
|
STREAMS propagation process source_queue, destination_queue, database_link aborted after 16 failures |
Stateless |
|
|
STREAMS apply process apply_name aborted with ORA-error_number |
Stateless |
|
|
STREAMS error queue for apply process apply_name contains new transaction with ORA-error_number |
Stateless |
|
|
Automatically set by alert infrastructure |
Stateful |
Alerts also appear when a statistic passes a metric threshold. For example, an alert appears when an Oracle Streams statistic passes a threshold for latency or throughput.
Note:
Oracle Streams alerts are informational only. They do not need to be managed. If you monitor your Oracle Streams environment regularly and address problems as they arise, then you might not need to monitor Oracle Streams alerts.See Also:
Capture Aborts Alert
This alert indicates a critical error. The capture process stops and any replication that depends on the capture process also stops. Also, the capture process makes no further progress in scanning the redo log until it is restarted.
Obtain the exact error message in one of the following ways:
-
In Enterprise Manager, see "Viewing Information About a Capture Process" for instructions.
-
In SQL*Plus, query the
ALL_CAPTUREview.
Take the appropriate action for the error.
After taking the appropriate action, restart the capture process in one of the following ways:
-
In Enterprise Manager, see "Starting and Stopping a Capture Process" for instructions.
-
In SQL*Plus, run the
DBMS_CAPTURE_ADM.START_CAPTUREprocedure.
Propagation Aborts Alert
This alert indicates a critical error. The propagation stops, and the messages that are normally sent from one queue to another by the propagation remain in the source queue. Replication that depends on the propagation also stops. Eventually, the source queue can grow too large, and messages can spill to disk. When messages spill to disk, it degrades Oracle Streams performance.
Obtain the exact error message in one of the following ways:
-
In Enterprise Manager, see "Viewing Information About a Propagation" for instructions.
-
In SQL*Plus, query the
DBA_QUEUE_SCHEDULESview.
Take the appropriate action for the error.
After taking the appropriate action, restart the propagation in one of the following ways:
-
In Enterprise Manager, see "Enabling and Disabling a Propagation" for instructions.
-
In SQL*Plus, run the
DBMS_PROPAGATION_ADM.START_PROPAGATIONprocedure.
Apply Aborts Alert
This alert indicates a critical error. The apply process stops, and the messages that are normally dequeued by the apply process remain in the apply process's queue. Replication that depends on the apply process also stops. Eventually, the apply process's queue can grow too large, and messages can spill to disk. Other queues that send messages to the apply process's queue might also grow and spill messages to disk. When messages spill to disk, it degrades Oracle Streams performance.
Obtain the exact error message in one of the following ways:
-
In Enterprise Manager, see "Viewing Information About an Apply Process" for instructions.
-
In SQL*Plus, query the
ALL_APPLYview.
Take the appropriate action for the error. If the error is an ORA-26714 error, then consider setting the DISABLE_ON_ERROR apply process parameter to N to avoid aborting on future user errors. See "Setting an Apply Process Parameter" for instructions.
After taking the appropriate action, restart the apply process in one of the following ways:
-
In Enterprise Manager, see "Starting and Stopping an Apply Process" for instructions.
-
In SQL*Plus, run the
DBMS_APPLY_ADM.START_APPLYprocedure.
Apply Error Alert
This alert indicates that the apply process encountered an error when it was applying a transaction. The apply process moves all of the messages in the transaction to the error queue. Other transactions that depend on the error transaction might also result in apply errors, and the error queue might grow quickly. Therefore, an administrator should resolve the apply errors as soon as possible.
Manage the apply errors in the error queue in one of the following ways:
-
In Enterprise Manager, see "Managing Apply Errors" for instructions.
-
In SQL*Plus, query the
ALL_APPLY_ERRORview to view the errors, resolve the errors, and either execute or delete the errors using procedures in theDBMS_APPLY_ADMpackage.
Oracle Streams Pool Alert
A metric is a unit of measurement used to report the health of the system. This alert is generated when the memory usage of the Oracle Streams pool has exceeded the percentage specified by the STREAMS_POOL_USED_PCT metric.
This alert can be raised only if the database is not using Automatic Memory Management or Automatic Shared Memory Management. Specifically, this alert can only be raised if the following initialization parameters are set to 0 (zero) or are unset:
Note:
Oracle recommends using either Automatic Memory Management or Automatic Shared Memory Management.This metric threshold can be set automatically by the alert infrastructure, or you can set it using Enterprise Manager. If the currently running workload is typical, then consider increasing the size of the Oracle Streams pool. Some of the links under the Related Topics heading on the Database Home page enable you to manage metrics. See Oracle Database 2 Day DBA for information about viewing and setting metric thresholds.
Managing Apply Errors
Apply errors can occur for a variety of reasons. When a change in a transaction causes an apply error, the apply process moves the change and all of the other changes in the same transaction to the error queue. When apply errors occur, you must identify the cause of the error and correct it. You can retry a specific error transaction or you can retry all error transactions for an apply process.
The following topics describe managing apply errors:
See Also:
Correcting Apply Errors in Database Objects
You might need to make data manipulation language (DML) or data definition language (DDL) changes to database objects to correct the conditions that caused one or more apply errors before you retry error transactions. If you must make changes to a database object, but you do not want to replicate these changes, then set a session tag in the session that makes the changes.
For example, to update the hr.employees table to correct an apply error:
-
Open SQL*Plus and connect as a user who can update the
hr.employeestable.See Oracle Database 2 Day DBA for more information about starting SQL*Plus.
-
BEGIN
   DBMS_STREAMS.SET_TAG(
      tag  =>  HEXTORAW('1D'));
END;
/
Ensure that you set the tag to a value that prevents changes from being captured by capture processes and synchronous captures.
-
Update the
hr.employeestable to correct the error. -
Exit the SQL*Plus session.
After you correct the problem that caused one or more error transactions, you can retry the error transactions or delete them. See "Retrying or Deleting Apply Error Transactions" for instructions.
For information about specific apply errors and how to correct them, see Oracle Streams Concepts and Administration.
Retrying or Deleting Apply Error Transactions
"Correcting Apply Errors in Database Objects" describes correcting the problem that caused one or more error transactions. After you correct the problem, you can retry the error transactions or delete them:
-
Retry the transactions if the changes in the transaction should be made to the destination table. Retry them only if you have not already modified the data in the table to make these changes.
-
Delete the transactions if you made all of the changes in the transactions to the destination table, or if the changes should not be made to the table.
To retry or delete apply error transactions:
-
In Oracle Enterprise Manager, log in to the database as the Oracle Streams administrator.
-
Go to the Database Home page.
-
Under High Availability, click the number link in Streams Components.
The Manage Replication page appears, showing the Overview subpage.
-
Click Streams to open the Streams subpage.
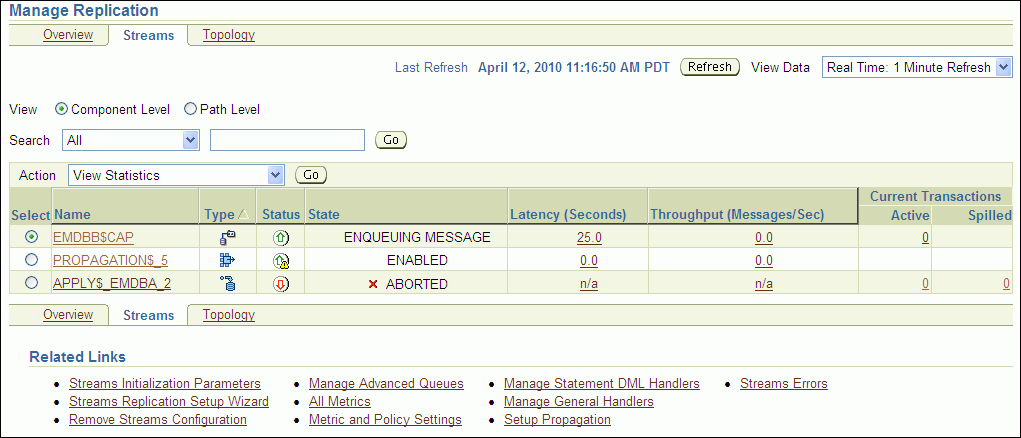
Description of the illustration tdpii_strms_ap_error.gif
When an apply process has one or more errors, the Status icon changes to include a warning symbol. Also, an apply error might cause an apply process to abort. When an apply process aborts, the status of the apply process is
ABORTED. -
Select the apply process with error transactions in the list of components. If necessary, use the search tool to find the apply process, and then select it.
-
Select View Errors in Action.
-
Click Go to open the View Apply Details page.
The errors appear in the Errors section, under Transaction Errors.

Description of the illustration tdpii_apply_errors.gif
You can view detailed information about an error by clicking the icon in the View Error LCRs field for the error transaction. The detailed information appears on the View Error LCRs page and includes each change in the transaction.

Description of the illustration tdpii_view_error_lcrs.gif
To drill down further, select a row change and click Compare Values. The Compare Values page appears and compares the row change with the data in the table to which the change should be applied.

Description of the illustration tdpii_compare_error_values.gif
-
If you drilled down to more information about an error, then go back to the Apply Errors page by clicking the View Apply Details link and expanding Transaction Errors.
-
On the Apply Errors page, complete one of the following actions:
-
To retry all error transactions, click Retry all Errors.
-
To delete all error transactions, click Delete All.
-
To retry a specific error transaction, select the error transaction and click Retry Error.
-
To delete a specific error transaction, select the error transaction and click Delete.
-
Note:
You can also use the following procedures in theDBMS_APPLY_ADM package to delete or reexecute error transactions:
Managing a Replication Environment When a Destination Is Unavailable
Sometimes, a destination queue in an Oracle Streams replication environment stops accepting propagated changes. The destination queue might stop accepting changes if, for example, the database that contains the queue goes down, there is a problem with the destination queue, the computer system running the database that contains the queue goes down, or for some other reason.
When a destination is unavailable in a replication environment that uses capture processes, captured changes that cannot be sent to a destination queue remain in the source queue. The source queue size increases and, eventually, the changes spill out of the buffered queue memory onto disk. When this happens, the performance of the Oracle Streams replication environment suffers.
To determine whether a large number of captured changes are spilling to disk, follow the instructions in "Viewing Statistics for a Capture Process". The Queue Statistics graph shows the current number of changes spilling to disk in the capture process's queue.
If your replication environment uses capture processes to capture changes, then you can set two capture process parameters to manage an unavailable destination automatically. The split_threshold and merge_theshold capture process parameters control whether Oracle Streams performs split and merge operations automatically. When these parameters are set to specify automatic split and merge, Oracle Scheduler jobs monitor the streams flowing from the capture process. When an Oracle Scheduler job identifies a problem with a stream, the job submits a new Oracle Scheduler job to split the problem stream off from the other streams flowing from the capture process. Other Oracle Scheduler jobs continue to monitor the stream, and, when the problem is corrected, an Oracle Scheduler job merges the stream back with the other streams.
When the split_threshold capture process parameter is set to INFINITE, automatic splitting is disabled. When the split_threshold parameter is not set to INFINITE, automatic splitting is enabled. Automatic splitting only occurs when communication with an apply process has been lost for the number of seconds specified in the split_threshold parameter. For example, communication with an apply process is lost when an apply process becomes disabled or a destination database goes down.
Note:
Automatic splitting does not occur when one stream is processing changes slower than other streams. In this situation, it is usually best to reconfigure the environment so that the slower stream uses a different capture process than the other streams.To manage the unavailable destination:
-
Ensure that the following parameters are set properly for the capture process to enable automatic split and merge:
-
split_threshold: Ensure that this parameter is not set to infinite. The default setting for this parameter is1800. -
merge_threshold: Ensure that this parameter is not set to a negative value. The default setting for this parameter is60.
-
-
Monitor the
DBA_STREAMS_SPLIT_MERGEview periodically to check whether an automatic split and merge operation is in process.When an automatic split occurs, certain components, such as the capture process, queue, and propagation, are cloned, and each is given a system-generated name. The
DBA_STREAMS_SPLIT_MERGEview contains the name of each cloned component, and other information about the split and merge operation. -
If a split and merge operation is in process, then correct the problem with the destination. The problem is corrected when the apply process at the destination database can accept changes from the cloned capture process.
-
If the cloned capture process is disabled, then start the cloned capture process. See "Starting and Stopping a Capture Process"
See Also:
-
Oracle Streams Replication Administrator's Guide for detailed instructions about using split and merge