Creating Reports
In Oracle Application Express, a report is the formatted result of a SQL query. You can generate reports by selecting and running a built-in query, or by defining a report region based on a SQL query.
Topics in this section include:
Creating a Report Using a Wizard
Application Builder includes a number of built-in wizards for generating reports.
To create a report using a wizard:
-
On the Workspace home page, click the Application Builder icon.
-
Select the application.
-
Click Create Page and click Next.
-
Select Report.
-
Select a report type and click Next:
-
SQL Report - Creates a report based on a custom SQL
SELECTstatement or a PL/SQL function returning a SQLSELECTstatement that you provide. For assistance in writing the SQL query, click the Query Builder button. -
Interactive Report - Creates an interactive report based on a custom SQL
SELECTstatement you provide. For assistance in writing the SQL query, click the Query Builder button. End users can customize the report layout and data displayed by selecting options on the Actions menu. -
Report on Web Service Result - Creates a report based on a Web service result. To learn more, see "Implementing Web Services".
-
Wizard Report - Creates a classic report without requiring any SQL knowledge. Select the appropriate schema, table, columns, and result set display.
-
-
Follow the on-screen instructions. To learn more about a specific field, click the item label.
When Help is available, the item label changes to red when you pass your cursor over it and the cursor changes to an arrow and question mark. See "About Field-Level Help".
See Tutorials:
"How to Create a Drill Down Report" and "How to Create a Parameterized Report" in Oracle Application Express Advanced TutorialsUnderstanding the Difference Between Interactive and Classic Reports
Oracle Application Express includes two main report types, an interactive report and a classic report. The main difference between these two report types is that interactive reports enable the user to customize the appearance of the data through a searching, filtering, sorting, column selection, highlighting, and other data manipulations.
The following is an example of an interactive report.
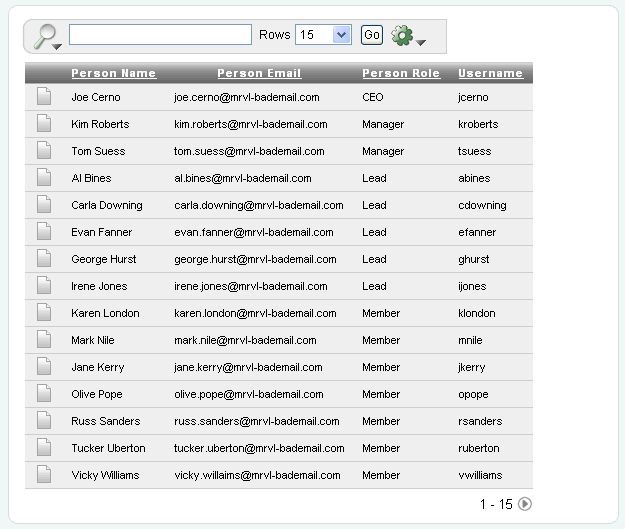
Description of the illustration rpt_ir.gif
Notice that the interactive report includes a Search Bar, Column Heading Menu links, and Link Column icons in the first column of each row. For a complete description of these components, see "Using Interactive Reports".
In contrast, a classic report does not include any of these customization features. The following is an example of a classic report built on top of the same data.
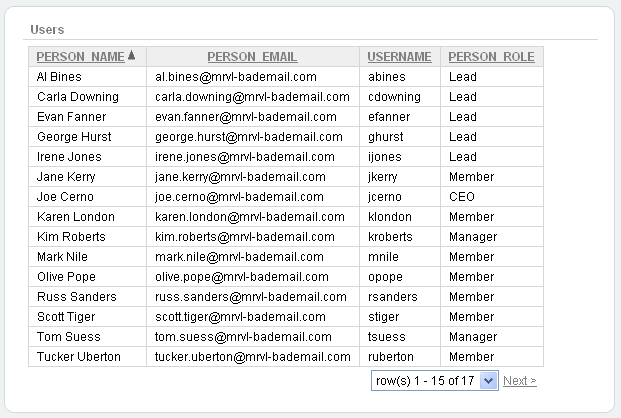
Description of the illustration rpt_classic.gif
Classic reports do not include a Search Bar and the links at the top of each column only support basic sorting.
Using Interactive Reports
Interactive reports include components that enable users to alter the layout of report data. Users can select columns, create filters, apply highlighting, sort columns, define break groups, aggregate columns, create charts, and define computations. Once customized, users can then save an interactive report as named report and download the data to various file formats.
See Also:
"Editing Interactive Reports"Topics in this section include:
About the Search Bar
Description of the illustration ir_search_bar.gif
A search bar displays at the top of every interactive report and includes the following features:
-
Search columns icon - Resembles a magnifying glass. Click this icon to narrow your search to only specific columns. To search all columns, select All Columns.
-
Text area - Enter case insensitive search criteria (wild card characters are implied) and then click Go.
-
Rows - Selects the number of rows to display per page.
-
Go button - Executes a search.
-
Actions menu - Displays the Actions menu. See "About the Actions Menu".
Searching Specific Columns
Clicking the Search columns icon (resembles a magnifying glass) displays a listing of all columns in the current report.
To use the Search columns icon:
-
Click the Search columns icon and select a column.
The column name displays to the right of the Search columns icon.
-
Enter keywords in the Text area and click Go.
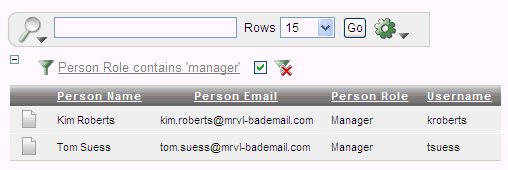
Description of the illustration ir_srch_col.gif
Notice the filter
Person Role contains 'manager'has been added to the Report Settings area above the report. -
To disable the filter, select the Enable/Disable Filter check box.
-
To delete the filter, click the Remove Filter icon.
See Also:
"Selecting Columns to Display"Editing a Filter
To edit an existing filter:
-
Click the filter name.
The filter appears.
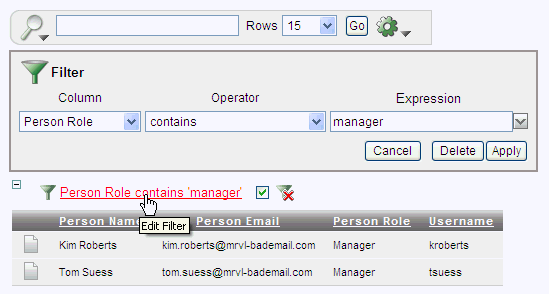
Description of the illustration ir_edit_srch_col_filter.gif
-
Edit the the Column, Operator, and Expression fields.
-
Click Apply.
About Link Column Icons
Link Column icons display on the far left of each row in an interactive report. A Link Column can link to a single row view, a custom target, or be excluded from the report. To learn more about customizing this interactive report attribute, see "Understanding Link Columns" and "Creating a Column Link in an Interactive Report".
About the Actions Menu
The Actions menu appears to the right of the Go button on the Search bar. Use this menu to customize an interactive report.
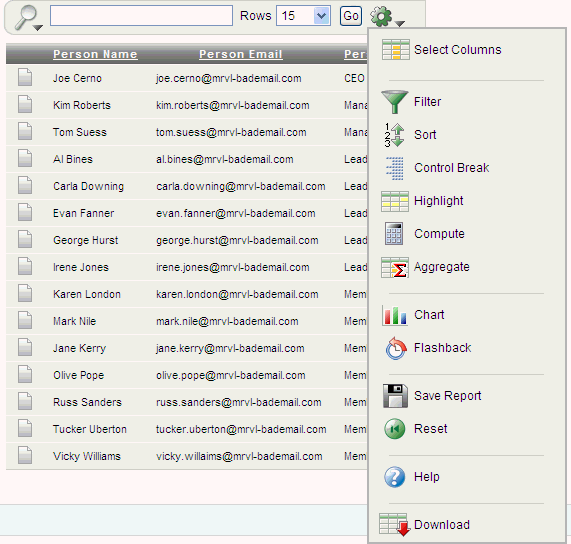
Description of the illustration ir_action_menu.gif
The Actions menu contains the following options:
-
Select Columns specifies which columns to display and in what order. See "Selecting Columns to Display".
-
Filter focuses the report by adding or modifying the
WHEREclause on the query. See "Adding a Filter". -
Sort specifies which columns to sort on and the sort order (that is, ascending or descending). See "Selecting Columns and Sort Order".
-
Control Break creates a break group on one or several columns. See "Creating a Control Break".
-
Highlight defines a filter that highlights the rows that meet the filter criteria. See "Adding Highlighting".
-
Compute enables users to add computed columns to a report. See "Computing Columns".
-
Aggregate enables users to perform mathematical computations against a column. See "Aggregating a Column".
-
Chart displays the report data as a chart. See "Creating a Chart".
-
Flashback performs a flashback query enabling users to view the data as it existed at a previous point in time. See "Executing a Flashback Query".
-
Save Report saves the current customized report settings so they can be used in the future. See "Saving a Report".
-
Reset enables users to reset the report back to the default report settings. See "Resetting a Report".
-
Help provides detailed descriptions of how to use the interactive report components to customize your reports.
-
Download enables users to download a report. Available download formats depend upon your installation and report definition. See "Downloading a Report".
Selecting Columns to Display
To customize a report to include specific columns, select Select Columns on the Actions menu.
To use the Select Columns option:
-
Click the Actions menu and select Select Columns.
The Select Columns region appears.
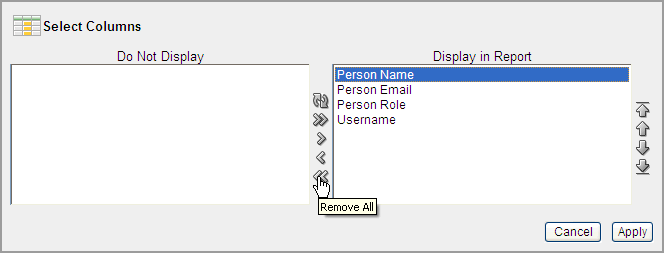
Description of the illustration ir_select_col.gif
-
Select the columns you wish to move. Cclick the arrows in the center of region to move a column from the Display in Report box to the Do Not Display in Report box. To select multiple columns at once, press and hold the CTRL key.
-
To change the order of the columns, click the Top, Up, Down, and Bottom arrows on the right.
-
Click Apply.
A revised report appears.
See Also:
"Resetting a Report"Adding a Filter
You can create a filter to focus a report by selecting Filter on the Actions menu. This option enables you to add or modify the WHERE clause in the query.
To add a filter:
-
Click the Actions menu and select Filter.
The Filter region appears.
-
Select a column, an operator, and expression.

Description of the illustration ir_filter.gif
In the previous example, the filter will display all people who have the Person Role of Lead.
-
Click Apply.
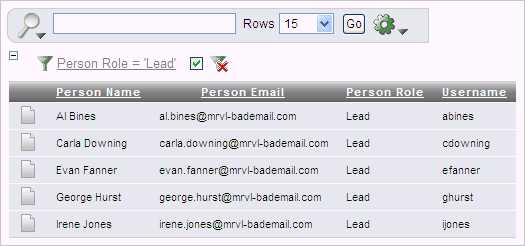
Description of the illustration ir_select_col_rpt.gif
Notice the filter
Person Role contains 'Lead'has been added to the Report Settings area above the report. -
To revise the filter:
-
Click the filter name (in this example,
Person Role contains 'Lead'). -
Edit your selections and click Apply.
-
-
To disable the filter, select the Enable/Disable Filter check box.
-
To delete the filter, click Remove Filter.
Selecting Columns and Sort Order
You can specify which columns to display and the sort order (ascending or descending) by selecting Sort on the Actions menu.
To sort by column:
-
Click the Actions menu and select Sort.
The Sort region appears.
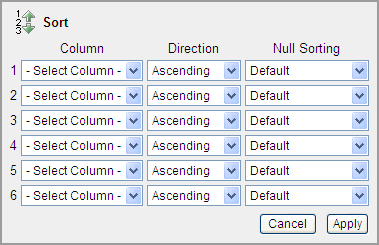
Description of the illustration ir_sort.gif
-
Select a column, the sort direction (Ascending or Descending), and Null Sorting behavior (Default, Nulls Always Last, or Nulls Always First).
-
Click Apply.
Creating a Control Break
You can create a break group of one or several columns by selecting Control Break from the Actions menu. Creating a break group pulls the columns out of the interactive report and displays them as a master record.
To create a break group:
-
Click the Actions menu and select Control Break.
The Control Break region appears.
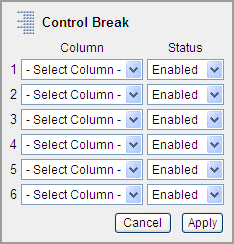
Description of the illustration ir_ctrl_break.gif
-
Select a column and then a status (Enable or Disable)
-
Click Apply.
One or more break groups display in Report Settings area above the report.
-
To expand the break group, click the plus (+) sign.
-
To enable the Control Break filter, select the Enable/Disable Filter check box.
-
To delete the filter, click Remove Filter.
Adding Highlighting
You can customize the display to highlight specific rows in a report by selecting Highlight on the Actions menu.
To create highlighting:
-
Click the Actions menu and select Highlight.
The Highlight region appears.
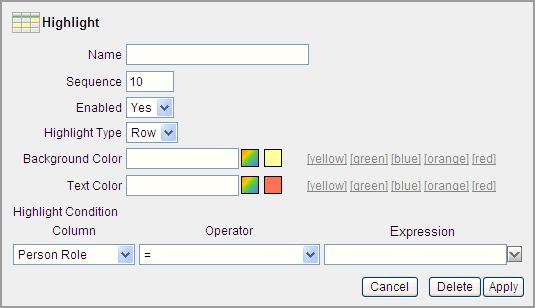
Description of the illustration ir_highlight.gif
-
Enter the following information:
-
Name - Enter a name to define this filter.
-
Sequence - Enter numeric value to identify the sequence in which the rules are evaluated.
-
Highlight Type - Select Cell or Row. If Cell is selected, the column referenced in the Highlight Condition is highlighted.
-
Background Color - Select a new color for the background of the highlighted area.
-
Text Color - Select a new color for the text in the highlighted area.
-
Select a column, an operator, and expression.
-
-
Click Apply.
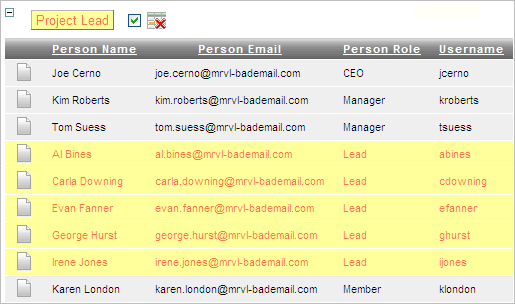
Description of the illustration ir_highlight_rpt.gif
Notice a new filter appears in the Report Settings area above the report.
-
To revise the filter:
-
Click the filter name (in this example, Project Lead).
-
Edit your selections and click Apply.
-
-
To disable the filter, select the Enable/Disable Filter check box.
-
To delete the filter, click Remove Filter.
Computing Columns
You can add computations to columns by selecting Compute from the Actions menu.
To create a computation:
-
Click the Actions menu and select Compute.
The Compute region appears.
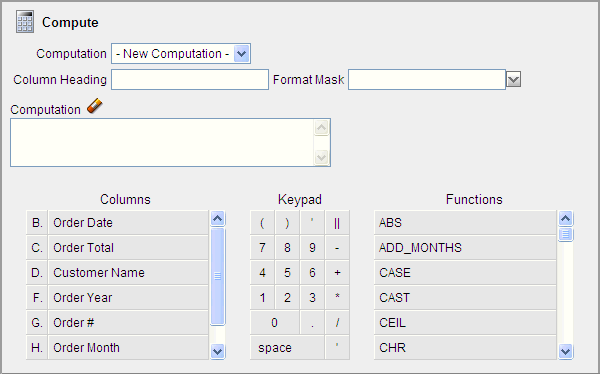
Description of the illustration ir_compute.gif
-
From Computation, select a previously defined computation or select New Computation.
-
For Column Heading, enter a heading for the new column.
-
For Format Mask, select an Oracle format mask to be applied to the new column.
Next, create the computation. Use the Columns, Keypad, and Functions sections to create a computation.
-
To create the computation:
-
Columns - Select the column name or alias to be added to the computation.
-
Keypad - Click the appropriate options. This section provides shortcuts for commonly used keys.
-
Functions - Select the appropriate function.
-
-
Click Apply.
Aggregating a Column
You can define a mathematical computation against a column (or aggregate) by selecting Aggregate from the Actions menu. Aggregates are displayed after each control break and at the end of the report within the column in which they are defined.
To aggregate columns:
-
Click the Actions menu and select Aggregate.
The Aggregate region appears.
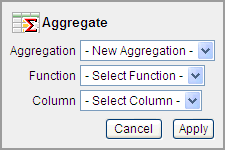
Description of the illustration ir_aggreg.gif
-
From Aggregation, select a previously defined aggregation or select New Aggregation.
-
For Function, select one of the following: Sum; Average, Count, Minimum, Maximum, or Median.
-
For column, select a column name or alias.
-
Click Apply.
The computation appears at the bottom of the report.
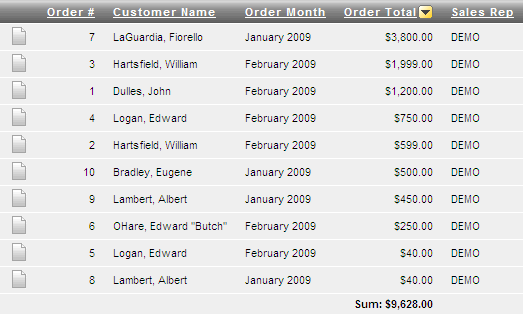
Description of the illustration ir_aggreg_rpt.gif
In this example, the aggregate shows the sum of all amounts in the Order Total column.
-
To remove the aggregate:
-
Select Aggregate from the Actions menu.
The Aggregate region appears.
-
Creating a Chart
To create a chart, select Chart on the Actions menu. You can create one chart for each interactive report. Once defined, you can switch between the chart and report views using links on the Search bar.
To create a chart:
-
Click the Actions menu and select Chart.
The Chart region appears.
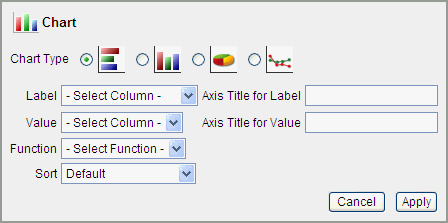
Description of the illustration ir_chart.gif
-
In the Chart region, specify the following:
-
Chart Type - Select the type of chart you wish to create.
-
Label - Select the column to be used as the label.
-
Axis for Title for Label - Enter title to be displayed on the axis associated with the column selected for Label (not available for pie chart).
-
Value - Select the column to be used as the Value. If your function is a
COUNT, a Value does not need to be selected. -
Axis Title for Value - Enter the title to display on the axis associated with the column selected for Value (not available for pie chart).
-
Function - (Optional) Select a function to be performed on the column selected for Value.
Edit Chart and View Chart links appear beneath the Search bar.
-
-
To alter the chart, click Edit Chart.
-
To return to the report, click View Report.
-
To delete the chart, click Edit Chart and then Delete.
Executing a Flashback Query
You can execute a flashback query by selecting Flashback from the Actions menu. A flashback query enables you to view the data as it existed at a previous point in time. The default amount of time that you can flashback is 3 hours (or 180 minutes) but the actual amount will differ for each database.
To execute a flashback query:
-
Click the Actions menu and select Flashback.
-
In the Flashback region, enter the number of minutes.
-
Click Apply.
Saving a Report
You can save a customized report by selecting Save Report from the Actions menu. You can choose to save a Named Report or Default Report Settings.
Tip:
The Save Report option does not display if an authentication scheme is not defined for the current application. See "Establishing User Identity Through Authentication".Saving a Interactive Report
To save an interactive report:
-
Run the report.
-
From the Actions menu, select Save Report.
-
In Save Report:
-
Save - Select As Named Report.
-
Name - Enter a name for the report.
-
Description - Enter an optional description.
-
Click Apply.
-
Tip:
To save a named report saved to a new page, disable Show Saved Reports as Tabs under Advanced Attributes. See "Configuring Advanced Attributes for Interactive Reports"Saving Default Report Settings
Default report settings determine the way a report initially displays to end users. End users can then modify any of the settings.
To save default report settings:
-
Click the Actions menu and select Save Report.
-
From Save, select As Default Report Settings.
-
Click Apply.
Resetting a Report
You can reset a report back to the default settings by selecting Reset from the Actions menu. Resetting a report removes any customizations you have made.
To reset a report:
-
Click the Actions menu and select Reset.
-
Click Apply.
Downloading a Report
You can download an interactive report back by selecting Download from the Actions menu. Available download formats depend upon your installation and report definition but may include comma-delimited file (CSV) format, Microsoft Excel (XLS) format, Adobe Portable Document Format (PDF), and Microsoft Word Rich Text Format (RTF).
To download a report:
-
Click the Actions menu and select Download.
-
Select a report download format and follow the provided instructions.
Editing Interactive Reports
By default, an interactive report includes a Search Bar, Column Heading Menu links, and Link Column icons. Users can use these components to alter the layout of report data by selecting columns, applying filters, highlighting, and sorting. This section describes how developers can customize an interactive report by editing report attributes.
Topics in this section include:
-
Removing or Customizing a Search Bar in an Interactive Report
-
Defining a Column as a List of Values in an Interactive Report
See Also:
"Using Interactive Reports"Accessing the Interactive Report Attributes Page
You can access the Interactive Report Attributes page by clicking the Interactive Report link next to the report region you want to edit on the Page Definition. You can also navigate to the Report Attributes page by clicking the region name and then selecting the Report Attributes tab.

Description of the illustration int_rprt_att.gif
To access the Report Attributes page:
-
On the Workspace home page, click the Application Builder icon.
-
Select the application.
-
Select a page.
The Page Definition appears.
-
Under Regions, click Interactive Report next to the name of the report region you want to edit.
The Report Attributes page appears and is divided into the following sections:
-
Column Attributes control the report layout. See "Editing Interactive Report Column Attributes".
-
Column Groups attributes enable you to group columns together on the single row view. See "Creating Column Groups".
-
Default Report Settings displays the initial way a report displays to end users. See "Saving Default Report Settings".
-
Pagination attributes control report pagination. See "Controlling Interactive Report Pagination".
-
Sorting attributes enable you to define images and image attributes for images that display in report headings to sort values. See "Managing Interactive Report Column Sorting".
-
Search Bar contain attributes that enable you to define a search bar within an interactive report. See "Removing or Customizing a Search Bar in an Interactive Report".
-
Download enables you to add a download option to the Actions menu and export the report as CSV, XLS, PDF, or RTF file. See "Adding a Download Option to the Actions Menu".
-
Link Column attributes enable you to add a link to a column. See "Creating a Column Link in an Interactive Report".
-
Advanced Attributes enable you to define a report alias, send a user a saved view of a report, show saved reports as tabs, prevent execution of queries that take a specified amount of time to execute, and define items to set into session state. See "Configuring Advanced Attributes for Interactive Reports".
-
-
To learn more about a specific attribute, click the item label.
When Help is available, the item label changes to red when you pass your cursor over it and the cursor changes to an arrow and question mark. See "About Field-Level Help".
See Also:
"Creating a Column Link in a Classic Report" and "Defining an Updatable Column in a Classic Report", and "Defining a Column as a List of Values in a Classic Report", and "Controlling When Columns Display in a Classic Report"About Navigation Alternatives
The Report Attribute page is divided into these sections: Column Attributes, Groups, Default Report, Pagination, Sorting, Search Bar, Download, Link Column, Advanced, and Description.
You can access these sections by scrolling down the page, or by clicking a navigation button at the top of the page.

Description of the illustration int_rprt_nav.gif
When you select a button at the top of the page, the selected section appears and all other sections are temporarily hidden. To view all sections of the page, click Show All.
Editing Interactive Report Column Attributes
You can use the Column Attributes section of the Report Attributes page to precisely control the report layout. For example, you can use these attributes to alter column heading text, change column positioning, or hide a column.
To access Column Attributes:
-
On the Workspace home page, click the Application Builder icon.
-
Select the application.
-
Select a page.
The Page Definition appears.
-
Under Regions, click Interactive Report next to the name of the report region you want to edit.
The Interactive Report Attributes page appears with the Column Attributes section at the top of the page.
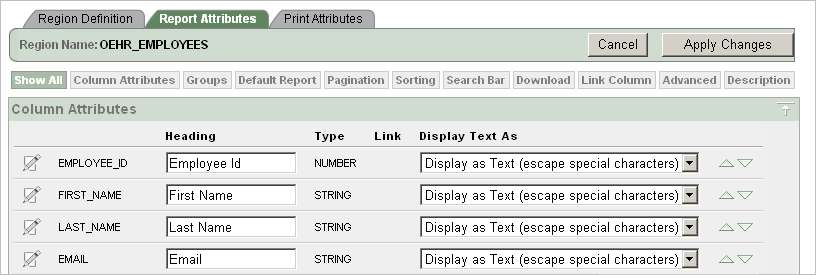
Description of the illustration int_rprt_col.gif
Use the Column Attributes section to control report column appearance and functionality.
Heading displays the heading text to be included in the report. Type indicates the type of query column. The Link column indicates if a link column is currently defined.
Table 7-1 describes common report column edits.
Table 7-1 Common Report Column Edits for Interactive Reports
Description Developer Action Alter column display sequence.
Click the up and down arrows to change the column display sequence.
Change column group assignment.
If Column Groups are defined, individual columns can be assigned under Column Group.
Change column heading text.
Under Heading, enter different heading text.
Change how columns display.
Select an option from Display Text As.
You can further refine the attributes of a specific column on the Column Attributes page.
-
To access the Column Attributes page, click the Edit icon next to the appropriate column Alias.
You can control whether users can sort, filter, control breaks, aggregate, and create computations or chart, by selecting the appropriate check boxes under Allow Users To.
-
Under Column Definition, Allow Users To, select the appropriate check boxes.
To learn more about a specific attribute, click the item label.
Creating Column Groups
Use column groups to group columns together on a single row view.
To create a column group:
-
Navigate to the Interactive Report Attributes page. See "Accessing the Interactive Report Attributes Page".
The Interactive Report Attributes page appears.
-
Scroll down to Column Groups.
-
Click Add Group.
-
Under Column Group:
-
Sequence - Enter the display sequence for this column group. This attribute determines the order in which the column groups display in the detail view.
-
Group Name - Enter a column group name. This name displays in the region header in detailed view.
-
Description - Enter an optional description for the column group. This description never displays to the end user.
-
-
Click Create.
Controlling Interactive Report Pagination
You control how pagination displays by making selections from Pagination attributes on the Interactive Report Attributes page.
To access the Pagination section of the Report Attributes page:
-
Navigate to the Interactive Report Attributes page. See "Accessing the Interactive Report Attributes Page".
The Interactive Report Attributes page appears.
-
Scroll down to Pagination.
You use the Pagination attributes to select a pagination style, determine where pagination occurs, specify the maximum number of rows to query, and messages to display when more than the maximum number of rows are returned or if no rows are returned. Table 7-2 describes the available Pagination attributes.
Table 7-2 Pagination Attributes
| Attribute | Description |
|---|---|
|
Pagination Type |
Select a pagination type. Pagination provides the user with information about the number of rows and the current position within the result set. Pagination can be displayed above or below the report (or both) and can be positioned on the left or right. Available pagination options include:
|
|
Pagination Display Position |
Defines where pagination occurs. Pagination can be display on the left side, right side, at the bottom, or above the report. |
|
Show Null Values as |
Enter the text you want to display for null columns. The default value is |
|
Maximum Row Count |
Defines the maximum number of rows to query, for example, rows 1 - 10 or 456. If you set this attribute to 200, the result would appear as follows:
Note that this attribute impacts performance. Counting fewer rows can improve performance and counting thousands of rows can degrade performance. |
|
When more than maximum row data found message |
Defines the text message that displays when more than maximum row count are returned. |
|
When No Data Found Message |
Defines the text message that displays when the query does not return any rows. |
Managing Interactive Report Column Sorting
You manage column sorting on the Interactive Report Attributes page.
To manage column sorting:
-
Navigate to the Interactive Report Attributes page. See "Accessing the Interactive Report Attributes Page".
The Interactive Report Attributes page appears.
-
Under Column Attributes, click the Edit icon for the column for which you want to enable sorting.
-
Under Column Definition, select Sort and click Apply Changes.
The Interactive Report Attributes page appears.
-
Scroll down to Sorting.
-
Specify ascending and descending image attributes, or click set defaults.
Removing or Customizing a Search Bar in an Interactive Report
Search bars display above the report.
Description of the illustration search_bar.gif
To remove a search bar in your report:
-
Navigate to the Interactive Report Attributes page. See "Accessing the Interactive Report Attributes Page".
The Interactive Report Attributes page appears.
-
Scroll down to Search Bar.
-
For Include Search Bar, select Yes or No. Selecting No removes the following default components:
-
Search Field - Displays a text field in the search bar in which to enter search criteria.
-
Finder Drop Down - Enables users to search on a selected column or against all columns.
-
Rows Per Page Selector - Displays a select list to enable users to select the number of rows to display per page.
-
Actions Menu - Enables the user to customize the report based on selected Actions.
-
-
To customize the Actions Menu, select the Action functions to include.
-
For Button Template, select a template for buttons that display in the search region and in the dialogs.
-
For Finder Image, specify an image. If no image is defined,
#IMAGE_PREFIX#/htmldb/builder/builder_find.pngis used. -
For Actions Menu Image, specify an image. If no image is defined,
#IMAGE_PREFIX#/ws/action_dropdown.gifis used. -
For Search Button Label, enter the text to be used as the search button label.
-
For Maximum Rows Per Page, enter the maximum number to display in the Rows Per Page Selector in the search bar.
-
Click Apply Changes.
Adding a Download Option to the Actions Menu
You can add a Download option to the Actions menu to enable users to export an interactive report as a comma-delimited file (CSV) format, Microsoft Excel (XLS) format, Adobe Portable Document Format (PDF), and Microsoft Word Rich Text Format (RTF).

Description of the illustration download.gif
To add a download link to a report you must enable the CSV output option.
See Also:
"Automatic CSV Encoding"To enable the Enable CSV output option:
-
Navigate to the Interactive Report Attributes page. See "Accessing the Interactive Report Attributes Page".
The Interactive Report Attributes page appears.
-
Scroll down to Search Bar.
-
For Include Search Bar, select Yes and Actions Menu.
-
Under Include in Actions menu, select Download.
-
-
Scroll down to Download.
-
From Download Formats, select CSV - Comma-delimited file (CSV) file format.
Tip:
The Download option will not display in the Actions menu if no file formats are selected. -
In the CSV Separator, define the column separator. If no value is entered, a comma or semicolon is used depending on your current NLS settings.
-
In the CSV Enclosed By, enter delimiter character. This character is used to delineate the starting and ending boundary of a data value. Default delimiter is double quotation marks (" ").
-
In Filename, enter a name for the downloaded document. Do not specify a file extension, the extension is added automatically. If you leave this blank, the region name is used as the file name.
-
Click Apply Changes.
Understanding Link Columns
A Link Column displays on the left side of an interactive report. It can link to a single row view, a custom target, or be excluded from the report. Note that a Link Column cannot be sorted, hidden, or moved by an end user and does not interact with the standard column link defined on the Column Attributes page.
Linking to a Single Row View
To link to a single row view:
-
Navigate to the Interactive Report Attributes page. See "Accessing the Interactive Report Attributes Page".
The Interactive Report Attributes page appears.
-
Scroll down to Link Column.
-
For Link Column, select Link to Single Row View.
-
From Single Row View, select the appropriate options:
-
Allow Exclude Null Values - Excludes columns with null values.
-
Allow Displayed Columns - Displays only the columns shown in the report.
-
-
For Uniquely Identify Rows by, select ROWID or Unique Column.
If you select, Unique Column, specify the column in the Unique Column field.
-
For Link Icon, select an icon.
-
For Link Attributes (Optional), specify additional column link attributes to be included in the
<a href= >tag (for example, a link target, classes, or styles). -
Click Apply Changes.
Linking to a Specific Page
To link to a specific page:
-
Navigate to the Interactive Report Attributes page. See "Accessing the Interactive Report Attributes Page".
The Interactive Report Attributes page appears.
-
Scroll down to Link Column.
-
For Link Column, select Link to Custom Target.
-
For Link Icon, select an icon.
-
For Link Attributes (Optional), specify additional column link attributes to be included in the
<a href= >tag (for example, a link target, classes, or styles). -
For Target, select Page in this Application.
-
For Page, select the target page number. To reset the pagination for this page, select Reset Pagination.
-
For Request, specify the request to be used.
-
For Clear Cache, specify the pages (that is, the page numbers) on which to clear cache. You can specify multiple pages by listing the page numbers in a comma-delimited list. See "Linking to Interactive Reports".
-
For Name and Value, specify session state for a specific item.
-
Click Apply Changes.
Linking to a URL
To link to a URL:
-
Navigate to the Interactive Report Attributes page. See "Accessing the Interactive Report Attributes Page".
The Interactive Report Attributes page appears.
-
Scroll down to Link Column.
-
For Link Column, select Link to Custom Target.
-
For Link Icon, select an icon.
-
For Link Attributes (Optional), specify additional column link attributes that to be included in the
<a href= >tag (for example, a link target, classes, or styles). -
From Target, select URL.
-
In URL, enter the appropriate address.
-
For Checksum - Select one of the following:
-
Use default
-
Application Level - Link reusable by any user
-
User Level - Link reusable by current user
To learn more about each option, see item Help.
-
-
Click Apply Changes.
Excluding a Link Column
To exclude a column link:
-
Navigate to the Interactive Report Attributes page. See "Accessing the Interactive Report Attributes Page".
The Interactive Report Attributes page appears.
-
Scroll down to Link Column.
-
For Link Column, select Exclude Link Column.
-
Click Apply Changes.
Creating a Column Link in an Interactive Report
Use Column Attributes to create a link from a report to another page in your application or to a URL.
To create a column link to another page:
-
Navigate to the Interactive Report Attributes page. See "Accessing the Interactive Report Attributes Page".
The Interactive Report Attributes page appears.
-
Under Column Attributes, locate the column to contain the link.
-
Click the Edit icon next to the column name.
The Column Attributes page appears.
-
Scroll down to Column Link.
-
To create a column link to another page:
-
From Target, select Page in this Application.
-
(Optional) In Link Attributes, specify additional column link attributes to be included in the
<a href= >tag (for example, a link target, classes, or styles). -
In Link Text, enter the text to be displayed as a link, specify an image tag, or pick from the list of default images.
-
In Page, specify the target page number. To reset the pagination for this page, select Reset Pagination.
-
In Request, specify the request to be used.
-
In Clear Cache, specify the pages (that is, the page numbers) on which to clear cache. You can specify multiple pages by listing the page numbers in a comma-delimited list.
-
Use the Name and Value fields to specify session state for a specific item.
-
For Checksum - Select one of the following:
-
Use default
-
Application Level - Link reusable by any user
-
User Level - Link reusable by current user
To learn more about each option, see item Help.
-
-
-
Click Apply Changes.
To create a column link to a URL:
-
Navigate to the Interactive Report Attributes page. See "Accessing the Interactive Report Attributes Page".
The Interactive Report Attributes page appears.
-
Access the Column Attributes page by clicking the Edit icon next to the appropriate column.
The Column Attributes page appears.
-
Scroll down to Column Link.
-
Under Column Link, specify the following:
-
From Target, select URL.
-
In Link Text, enter the text to be displayed as a link and select a substitution string.
-
(Optional) In Link Attributes, specify additional column link attributes to be included in the
<a href= >tag (for example, a link target, classes, or styles). -
In URL, enter the appropriate address.
-
-
Click Apply Changes.
Defining a Column as a List of Values in an Interactive Report
In interactive reports you can use a list of values to improve the speed of built-in filter tools.
To define a report column as a list of values:
-
Navigate to the Interactive Report Attributes page. See "Accessing the Interactive Report Attributes Page".
The Interactive Report Attributes page appears.
-
Access the Column Attributes page by clicking the Edit icon next to the appropriate column.
The Column Attributes page appears.
-
Scroll down to List of Values.
-
From Column Filter List of Values, specify how to create a list of values as a filter on the report column list. Available options include:
-
None - Disable filter on list of values.
-
Default Based on Column Type -
STRINGandNUMBERcolumns derive list of values from distinct column values.DATEcolumns derive list of values from predefined date ranges. -
Use Defined List of Values - Derive list of values from defined list of values SQL Query.
-
List of values definition - If you select Use Defined List of Values, enter a SQL query that selects the distinct column values. Entering a SQL query can improve performance in some reports. This list of values will be displayed when a user clicks on a column header.
-
-
Click Apply Changes.
Configuring Advanced Attributes for Interactive Reports
Use the Advanced Attributes section to define a report alias, send a user a saved view of a report, show saved reports as tabs, prevent execution of queries that take a specified amount of time to execute, and define items to set into session state.
To configure Advanced Attributes:
-
Navigate to the Interactive Report Attributes page. See "Accessing the Interactive Report Attributes Page".
The Interactive Report Attributes page appears.
-
Scroll down to Advanced Attributes.
Table 7-3 describes the available Advanced Attributes.
| Attribute | Description |
|---|---|
|
Report Alias |
Enter an alphanumeric alias for this interactive report. You may use an alias to reference an interactive report in an API call (for example, to change the columns displayed). The alias must be unique within the application. |
|
Report ID Item |
This attribute enables you to send a user directly to a saved view of the report. You specify an item whose value stores the report ID of the saved view. Report ID's can be retrieved from the |
|
Show Saved Reports as Tabs |
If saved versions of the report exist, this attribute specifies if they should be displayed as tabs. To create a separate page with a list of reports, disable this attribute. |
|
Page Items to Submit |
Enter a comma separated list of items to be set into session state when the user clicks the Go button on the search bar. Only items on the current page will be set. |
Linking to Interactive Reports
Unlike classic reports which typically use page items as report parameters, the data in an interactive report is driven by declarative filters. However, the developer may desire to set these report parameters by modifying interactive report settings for an end user. These settings only affect the end user's working report and will not affect any saved report settings.
To reset an interactive report in a link, use the string "RIR" in the Clear-Cache section of a URL. This is equivalent to the end user choosing the Reset option from the interactive report actions menu on the target page. The report is returned to the default report settings specified by the developer or saved by the user.
To create a Row text contains filter on an interactive report, use the string IR_ROWFILTER in the Item Names section of the URL. Adding this string passes the filter value in the corresponding location in the Item Values section of the URL.
To create a filter on an interactive report in a link, use the string IR<operator>_<target column alias> in the Item Names section of the URL, and pass the filter value in the corresponding location in the Item Values section of the URL.
Valid operators include:
-
EQ= Equals (this is the default) -
NEQ= Not Equals -
LT= Less than -
LTE= Less then or equal to -
GT= Greater Than -
GTE= Greater than or equal to -
LIKE= SQL Like operator -
N= Null -
NN= Not Null -
C= Contains -
NC= Not Contains
Consider the following examples:
f?p=...:IR_ENAME:KING
The previous example is equivalent to the end user creating a filter on the target page: ENAME = KING. Note that when an operator is not provided, EQ is used because it is the default.
f?p=...:IRGT_SAL:3000
The previous example is equivalent to the end user creating a filter on the target page: SAL > 3000.
Editing SQL and Wizard Reports
You can control report layout, pagination, column sorting, error messages, export links, and column break of SQL and Classic reports using the Report Attributes page.
Tip:
With the addition of interactive reports in Oracle Application Express release 3.1, all previous report types are referred to as classic reports. See "Editing Interactive Reports".Topics in this section include:
See Tutorials:
Oracle Application Express Advanced TutorialsAccessing Classic Report Attributes
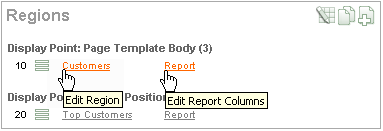
You can access the classic Report Attributes page by clicking the Report link next to the report region you want to edit on the Page Definition. You can also navigate to the Report Attributes page by clicking the region name and then selecting the Report Attributes tab.
Description of the illustration rprt_edit.gif
To access the Report Attributes page:
-
On the Workspace home page, click the Application Builder icon.
-
Select the application.
-
Select a page.
The Page Definition appears.
-
Under Regions, click Report next to the name of the report region you want to edit.
The Report Attributes page appears and is divided into the following sections:
-
Column Attributes control the report layout. See "Altering Classic Report Layout Using Column Attributes".
-
Layout and Pagination attributes control report pagination. See "Controlling Classic Report Pagination".
-
Sorting attributes enable you to define images and image attributes for images that display in report headings to sort values. See "Enabling Column Sorting in a Classic Report".
-
Messages contain attributes that enable you to define messages that display if no data is found or more data is found than can be displayed.
-
Report Export attributes enable you to add download link to a report or export a report as either an XML file or CSV file. See "Adding a Download Link to a Classic Report" and "Exporting a Classic Report as an XML File or a CSV File".
-
Break Formatting attributes enable you to control if a specific column repeats and how column breaks appear when printed. See "Controlling Column Breaks in a Classic Report".
-
-
To learn more about a specific attribute, click the item label.
When Help is available, the item label changes to red when you pass your cursor over it and the cursor changes to an arrow and question mark. See "About Field-Level Help".
-
Click Apply Changes.
See Also:
"Creating a Column Link in a Classic Report" and "Defining an Updatable Column in a Classic Report", and "Defining a Column as a List of Values in a Classic Report", and "Controlling When Columns Display in a Classic Report"About Navigation Alternatives
The Report Attribute page is divided into these sections: Column Attributes, Layout and Pagination, Sorting, Messages, Report Export, Break Formatting, and External Processing.
You can access these sections by scrolling down the page, or by clicking a navigation button at the top of the page.

Description of the illustration int_rprt_nav.gif
When you select a button at the top of the page, the selected section appears and all other sections are temporarily hidden. To view all sections of the page, click Show All.
Altering Classic Report Layout Using Column Attributes
You can use the Column Attributes section of the Report Attributes page to precisely control the report layout. For example, you can use these attributes to alter column heading text, change column positioning, hide a column, create a sum of a column, or select a sort sequence.
To access the Column Attributes:
-
On the Workspace home page, click the Application Builder icon.
-
Select the application.
-
Select a page.
The Page Definition appears.
-
Under Regions, click Report next to the name of the report region you want to edit.
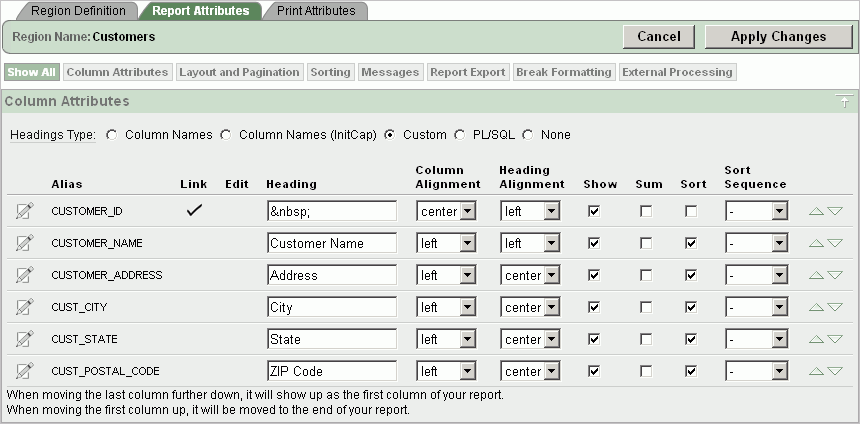
The Report Attributes page appears with the Column Attributes section at the top of the page.
Description of the illustration rpt_att.gif
Use the Column Attributes section to control report column appearance and functionality.
Heading Type identifies how the heading is generated for the report. The Link column indicates if a column link is currently defined. The Edit column indicates whether a column is currently updatable.
Table 7-4 describes common report column edits.
Table 7-4 Common Report Column Edits for Classic Reports
Description Developer Action Alter column display sequence.
Click the up and down arrows to change the column display sequence.
Alter heading alignment.
Under Column Alignment, select a column alignment.
Change column heading text.
Under Heading, enter different heading text.
Control which columns display.
Click Show to indicate a column should display.
Enable a unique sort sequence.
Click Sort and select a sequence number from Sort Sequence.
Any number of columns can be sort enabled. However, at least one column must have a Sort Sequence defined.
Enable the sum of a column.
Click Sum to enable the sum of a column.
You can further refine the attributes of a specific column on the Column Attributes page.
-
To access the Column Attributes page, click the Edit icon next to the appropriate column Alias.
To learn more about a specific attribute, click the item label.
When Help is available, the item label changes to red when you pass your cursor over it and the cursor changes to an arrow and question mark. See "About Field-Level Help".
Controlling Classic Report Pagination
You control report pagination by:
-
Including a pagination substitution string in the report template
-
Making selections from the Layout and Pagination section on the Report Attributes page
You control how pagination displays by making selections from the Layout and Pagination attributes on the Report Attributes page.
Topics in this section include:
Accessing and Understanding Layout and Pagination Attributes
To access the Layout and Pagination section of the Report Attributes page:
-
Create a report. See "Creating a Report Using a Wizard".
-
Navigate to the appropriate Page Definition. See "Accessing a Page Definition".
-
Under Regions, click the appropriate Report attributes link.
The Report Attributes page appears.
-
Scroll down to Layout and Pagination.
You use the Layout and Pagination attributes to select a pagination style, determine where pagination occurs, and specify the number of rows that display on each page. Table 7-5 describes the most commonly used Layout and Pagination attributes.
To learn more about a specific attribute, click the item label. When Help is available, the item label changes to red when you pass your cursor over it and the cursor changes to an arrow and question mark. See "About Field-Level Help".
Table 7-5 Layout and Pagination Attributes
| Attribute | Description |
|---|---|
|
Report Template |
Specifies a template to be applied to this report. Report templates provide control over the results of a row from your SQL query. You can choose from a number of default templates, or pick a custom build template. |
|
Report Attributes Substitution |
Enter a value to be in place of the |
|
Show Null Values as |
Enter the text you want to display for null columns. The default value is |
|
Pagination Scheme |
Specifies a pagination scheme for this report. Pagination provides the user with information about the number of rows and the current position within the result set. Pagination also defines the style of links or buttons used to navigate to the next or previous page. For more information, see the Help information for this attribute. |
|
Enable Partial Page Refresh |
If enabled, this attribute refreshed the report region when paginating forward and backward in your result set. |
|
Display Position |
Defines where pagination occurs. If you choose to display pagination above a report, the selected report template needs to support that type of display. |
|
Number of Rows |
Defines the maximum number of rows to display on each page. |
|
Number of Rows (Item) |
Defines the number of rows displayed by default per page for SQL queries (obtained dynamically from an item). Identify the item in this attribute. |
|
Maximum Row Count |
Defines the maximum number of rows to query, for example, rows 1 - 10 of 456. If you set this attribute to 200, the result would appear as follows:
Note that this attribute impacts performance. Counting fewer rows can improve performance and counting thousands of rows can degrade performance. |
|
Strip HTML |
Specify whether to remove HTML tags from the original column values for HTML expressions, column links and report data exported as CSV files. If you select values from the database that contain HTML tags, then those tags can cause conflicts with the HTML generated for your columns links or HTML expressions. When this option is enabled, only the actual data portion of your column value is used. |
|
Sort Nulls |
For reports with column heading sorting, specify if you want null valued columns to sort first or last. |
Including Pagination After the Rows in a Classic Report
To include pagination after the rows in a report:
-
Create a report. See "Creating a Report Using a Wizard".
Next, select the appropriate Layout and Pagination attributes.
-
Navigate to the Report Attributes page:
-
Navigate to the Page Definition. See "Accessing a Page Definition".
-
Under Regions, click the appropriate Report attributes link.
The Report Attributes page appears.
-
-
Under Layout and Pagination, select the following:
-
Report Template - Select a report template (optional).
-
Pagination Scheme - Select a pagination scheme.
-
Display Position - Select a display position.
-
Number of Rows - Specify how many rows display on each page.
-
Click Apply Changes.
-
-
Edit the report template:
-
Navigate to the Page Definition. See "Accessing a Page Definition".
-
Under Templates, select the report template name.
-
Include the
#PAGINATION#substitution string in the After Rows attribute. -
Click Apply Changes.
-
-
Run the page.
Including Pagination Before the Rows in a Classic Report
To include pagination before the rows in a report:
-
Create a report. See "Creating a Report Using a Wizard".
Next, select the appropriate Layout and Pagination attributes.
-
Navigate to the Report Attributes page:
-
Navigate to the Page Definition. See "Accessing a Page Definition".
-
Under Regions, click the appropriate Report attributes link.
The Report Attributes page appears.
-
-
Under Layout and Pagination:
-
Report Template - Select a report template (optional).
-
Pagination Scheme - Select a pagination scheme.
-
Display Position - Select a position that contains the word top.
-
Number of Rows - Specify how many rows display on each page.
-
Click Apply Changes.
-
-
Edit the report template.
-
Navigate to the Page Definition. See "Accessing a Page Definition".
-
Under Templates, select the report template name.
-
Include the
#TOP_PAGINATION#substitution string in the Before Rows attribute. -
Click Apply Changes.
-
-
Run the page.
Enabling Column Sorting in a Classic Report
You enable column sorting on the Report Attributes page.
To enable column sorting:
-
Navigate to the Report Attributes page. See "Editing SQL and Wizard Reports".
-
Under Column Attributes, select the Sort check box next to the columns to be sorted.
-
From Sort Sequence, select a sequence number.
Sort Sequence is optional. However, if there are one or more sort enabled columns, then at least one column needs a defined Sort Sequence.
-
Scroll down to Sorting.
-
Specify ascending and descending image attributes or click set defaults.
-
Click Apply Changes.
Tip:
Note that column sorting must be enabled if you want columns with null values to display at the top or end of the report. To learn more about the Sort Nulls attribute, see "Accessing and Understanding Layout and Pagination Attributes".Adding a Download Link to a Classic Report
You can create a link within a report that enables users to export the report as a comma-delimited file (.csv) file. To add a CSV link to a report you must enable the CSV output option. When using the CSV output option, the report template is not important. You can include a CSV link with any report template that has the CSV export substitution string defined.
See Also:
"Automatic CSV Encoding"Enabling the CSV Output Option in a Classic Report
To use the enable the Enable CSV output option:
-
Navigate to the appropriate Report Attributes page. See "Editing SQL and Wizard Reports".
-
Scroll down to Report Export.
-
From Enable CSV output, select Yes.
-
(Optional) In the Separator and Enclosed By fields, define the separator and delimiter.
The default Enclosed By by characters are a double quotation marks (" "). The default delimiter is either a comma or a semicolon depending upon your current NLS settings.
-
In the Link Label field, enter link text. This text will display in your report and enable users to invoke a download.
-
(Optional) To specify a default export file name, enter a name in the Filename field.
By default, the Application Express engine creates an export file name by taking the region name and adding the appropriate file name extension (
.csvor.xml). -
Click Apply Changes.
Exporting a Classic Report as an XML File or a CSV File
You can export a report as an XML file by selecting a report template.
To export a report as a file:
-
Navigate to the appropriate Report Attributes page. See "Editing SQL and Wizard Reports".
-
Scroll down to Layout and Pagination.
-
From the Report Template list, select export: XML or export: CSV.
Selecting export: XML prevents the Application Express engine from rendering the page and dumps the content to an XML file.
-
Click Apply Changes.
Creating a Column Link in a Classic Report
Use the Column Link attributes to create a link from a report to another page in your application or to a URL.
To create a column link to another page:
-
Navigate to the appropriate Report Attributes page. See "Editing SQL and Wizard Reports".
-
Under Column Attributes, locate the column to contain the link.
-
Click the Edit icon next to the column name.
The Column Attributes page appears.
-
Scroll down to Column Link.
-
To create a column link to another page:
-
From Target, select Page in this Application.
-
(Optional) In Link Attributes, specify additional column link attributes to be included in the
<a href= >tag (for example, a link target, classes, or styles). -
In Link Text, enter the text to be displayed as a link, specify an image tag, or pick from the list of default images.
-
In Page, specify the target page number. To reset the pagination for this page, select Reset Pagination.
-
In Request, specify the request to be used.
-
In Clear Cache, specify the pages (that is, the page numbers) on which to clear cache. You can specify multiple pages by listing the page numbers in a comma-delimited list. See "Linking to Interactive Reports".
-
Use the Name and Value fields to specify session state for a specific item.
-
-
Click Apply Changes.
To create a column link to a URL:
-
Navigate to the appropriate Report Attributes page. See "Editing SQL and Wizard Reports".
-
Access the Column Attributes page by clicking the Edit icon next to the appropriate column.
The Column Attributes page appears.
-
Scroll down to Column Link.
-
Under Column Link, specify the following:
-
From Target, select URL.
-
In Link Text, enter the text to be displayed as a link and select a substitution string.
-
(Optional) In Link Attributes, specify additional column link attributes to be included in the
<a href= >tag (for example, a link target, classes, or styles). -
In URL, enter the appropriate address.
-
-
Click Apply Changes.
Defining an Updatable Column in a Classic Report
You can make a column updatable by editing Tabular Form Element attributes on the Column Attributes page. Note that the Application Express engine can only perform updates if:
-
A multirow update is defined
-
A PL/SQL process is implemented to process updated data
-
When using the built-in tabular form elements and display types, then the report has to be defined using the type SQL Query (updatable report)
To define updatable column attributes:
-
Navigate to the appropriate Report Attributes page. See "Editing SQL and Wizard Reports".
-
Access the Column Attributes page by clicking the Edit icon next to the appropriate column.
The Column Attributes page appears.
-
Scroll down to Tabular Form Element.
-
Under Tabular Form Element, specify the following:
-
Display As - Select a type of updatable column.
Use this option to make a column updatable. Updates can only be performed if a multirow update is defined, or a PL/SQL process is implemented to process updated data.
-
Date Picker Format Mask - Make a selection if you selected the Display As type of Date Picker.
-
Element Width - Specify the width of the form item.
-
Number of Rows - Specify the height of a form item (applicable to text areas).
-
Element Attributes - Define a style or standard form element attribute.
-
Element Option Attributes - Specify form element attributes for items in a radio group or check box.
-
Primary Key Source Type - Identify the default type.
-
Primary Key Source - Identify the default source.
If the current column is part of the primary key defined in an MRU process, only the primary key source type and source appear.
Otherwise, Default and Default Type appear. Use Default and Default Type to establish a relationship between two master records in a master detail form, or to set the default values for new rows.
-
Reference Table Owner - Identify the owner of the referenced table. Use this attribute to build User Interface Defaults for reports.
-
Reference Table Name - Identify the table or view that contains the current report column.
-
Reference Column Name - Identify the column name that this report column references.
-
-
Click Apply Changes.
Defining a Column as a List of Values in a Classic Report
Report columns can be rendered as lists of values. For example, a column can be rendered using a select list or a popup list of values. Or, a column can be rendered as read-only text based on a list of values.
This last approach is an effective strategy when creating display lookup values and is particularly useful in regular, nonupdatable reports. This approach enables you to display the value of a column without having to write a SQL JOIN statement.
To render a report column as a list of values:
-
Navigate to the appropriate Report Attributes page. See "Editing SQL and Wizard Reports".
-
Access the Column Attributes page by clicking the Edit icon next to the appropriate column.
The Column Attributes page appears.
-
Scroll down to List of Values.
-
From Named LOV, make a selection from the List of Values repository. See "Creating Lists of Values".
-
To include a null value in a list of values:
-
In Display Null, select Yes.
-
In Null Text, specify the value that displays.
A column can also have a value that does not display in its list of values.
-
-
To define a value that does not display in the list of values:
-
From Display Extra Value, select Yes.
The extra value is used if the actual column value is not part of the LOV. In that situation, the actual value is shown. If you do not display extra values, you may end up with the wrong value and unintentionally update your data incorrectly.
-
In Null Value, specify the value that displays.
-
If you have not selected a Named LOV, enter the query used to display a select list in the LOV Query field.
-
-
If you have not selected a Named LOV, enter the query used to display a select list in LOV Query.
-
Click Apply Changes.
See Tutorials:
"How to Create a Tabular Form" in Oracle Application Express Advanced TutorialsControlling When Columns Display in a Classic Report
You can use the Authorization and Condition attributes to control when a column displays.
Authorization enables you to control access to resources (such as a report column) based on predefined user privileges. For example, you could create an authorization scheme in which only managers can view a specific report column. Before you can select an authorization scheme, you must first create it.
A condition is a small unit of logic that enables you to control the display of a column based on a predefined condition type. The condition evaluates to true or false based on the values you enter in the Expressions fields.
To specify Authorization and Condition attributes:
-
Navigate to the appropriate Report Attributes page. See "Editing SQL and Wizard Reports".
-
Access the Column Attributes page by clicking the Edit icon next to the appropriate column.
The Column Attributes page appears.
-
Under Authorization, make a selection from the Authorization Scheme list.
-
Under Conditions, make a selection from the Condition Type list, and depending upon your selection, enter an expression or value in the appropriate Expression fields.
If the authorization is successful and the condition type display evaluates to true, the column displays.
Controlling Column Breaks in a Classic Report
You can control if a specific column repeats and how column breaks appear when printed using Break Formatting attributes. For example, suppose your report displays employee information by department number. If multiple employees are members of the same department, you can increase the readability by specifying the department number only appears once.
To create this type of column break:
-
Navigate to the appropriate Report Attributes page. See "Editing SQL and Wizard Reports".
-
Scroll down to Break Formatting.
-
Make a selection from the Breaks list.
Printing Report Regions
You can configure a classic report region to print by exporting it to a number of different formats. Oracle BI Publisher supports Adobe Portable Document Format (PDF), Microsoft Word Rich Text Format (RTF), or Microsoft Excel format (XLS), or Extensible Markup Language (XML). The supplied OC4J with Apache FOP alternative only supports PDF and XML. If you choose to use other third-party rendering engines, other output formats can also be configured.
By taking advantage of region report printing, your application users can view and print reports that have a predefined orientation, page size, column headings, and page header and footer. Interactive reports also have the ability to export to PDF, RTF, Microsoft Excel and Comma Separated Values (CSV). Note that for interactive reports, it is not possible to define a custom report layout.
Topics in this section include:
Tip:
If you are running Oracle Application Express with Oracle Database 11g Release 1 (11.1), you must enable network services in order to use report printing. See "Enabling Network Services in Oracle Database 11g"See Also:
"How to Create a Master Detail PDF Report" in Oracle Application Express Advanced TutorialsAbout Printing Reports to PDF
When printing to a PDF, the report data is transformed using an externally defined report server. When the application end user clicks a print link, a request is sent to the Application Express engine. The Application Express engine then generates the report data in XML format and report template in XSL-FO or RTF format. The external reporting engine then transforms the data and the template into a PDF which displays to the end user using the conversion servlet that ships with BI Publisher 10.1.3.2 (formerly known as Oracle XML Publisher). Fortunately, this architectural complexity is transparent to both end users and developers. End users just click a print link, and developers just declaratively set regions to support PDF printing. Output to other formats operates in the same manner using the necessary conversion servlet.
About Report Printing Configuration Options
Your report server can be Oracle BI Publisher, OC4J with Apache FOP, or another standard XSL-FO processing engine. Oracle BI Publisher provides a higher level of functionality and facilitates "high fidelity" output requirements including master-detail reports, charts, and so on. To accommodate the difference in functionality, Oracle Application Express provides two report printing configuration options:
-
Standard Support. Enables you to print report regions and report queries using either the built-in templates (provided with a standard XSL-FO processing engine), or other XSL-FO compatible formats you provide. This setting does not support RTF.
Standard Support provides declarative formatting of report regions and report queries with basic control over page attributes, including page orientation, page size, column heading formats, page header, and page footer.
-
Advanced Support. Requires a valid license of Oracle BI Publisher (also known as Oracle XML Publisher). This setting, provides you with all the capabilities of the Standard configuration plus the ability to define RTF-based report layouts developed using the BI Publisher Word Template Builder.
To learn more about installing and configuring Oracle BI Publisher, see PDF Printing in Application Express 3.1. Go to:
http://www.oracle.com/technetwork/developer-tools/apex/overview/index.html
Note:
To use the full functionality of report printing, your Oracle Application Express service administrator must enable it for your site. See "Configuring Report Printing" in Oracle Application Express Administration Guide.About Classic Report Printing Methods
There are two ways to print classic report regions:
-
Configure Printing Attributes for a Report Region. You can print a report region by configuring the Printing Attributes for the region. See "Configuring Classic Report Region Print Attributes".
-
Create a Report Query. You can print a report by defining a report query as a Shared Component. See "About Report Queries".
Both report regions and report queries can be downloaded in the following formats:
-
PDF - Adobe Portable Document Format.
-
RTF - Microsoft Word Rich Text Format.
-
XLS - Microsoft Excel format. Note that this is not a true
.xlsfile because the content is HTML-based. -
HTML
-
XML - Extensible Markup Language.
To format either a report region or report query, you associate it with a report layout. To learn more, see "About Report Layouts".
About Report Queries
You can print a report region by defining a report query as a Shared Component. A report query identifies the data to be extracted. Unlike SQL statements contained in regions, report queries contain SQL statements that are validated when you save the query. Note that report queries must be SQL statements, not functions returning SQL statements.
You can associate a report query with a report layout and download it as a formatted document. If no report layout is selected, a generic layout is used. The generic layout is intended to be used to test and verify a report query. When using the generic layout option and multiple source queries are defined, only the first result set is included in the print document. The reports can include session state of the current application.
To make these reports available to end users, you then integrate them with an application. For example, you can associate a report query with a button, list item, branch, or other navigational component that enables you to use URLs as targets. Selecting that item then initiates the printing process.
Topics in this section include:
Creating a Report Query
Note that the availability of the report query options depends on how your service administrator configures report printing for your instance. All options described in these steps may not be available to you.
To create a report query:
-
Navigate to the Shared Components page. See "Accessing the Shared Components Page".
-
Under Reports, click Report Queries.
-
Click Create.
-
For Query, specify the following information:
-
Report Query Name - Enter a name to identify the report query. When referencing a report query as a link target, the report query name is part of the request string.
-
Output Format - Select the report output format. Valid options include:
-
PDF - Adobe Portable Document Format.
-
Word - Microsoft Word Rich Text Format.
-
Excel - Microsoft Excel format. Note that this is not a true
.xlsfile because the content is HTML-based. -
HTML
-
XML - Extensible Markup Language.
-
-
Item - Select the item to hold the format value. This can be used to determine the output format at runtime.
-
View File As - Select how the Web browser opens the report query document. Options include:
-
Attachment - Displays a File Open/Save dialog box when the user clicks the report query download button.
-
Inline - Displays the report query document inside the Browser window.
-
-
Session State - Select this check box to reference session state values, such as the values of page items in the XML structure of your report.
-
Click Next.
-
-
For SQL Query, enter a SQL statement directly or click Query Builder to build a SQL statement by clicking and pointing.
To reference applications and page items in the SQL statement, reference them as bind variables. Click Set Bind Variables to be able to enter in values for each bind variable and test the query to ensure the expected output is returned.
-
For Download Definition, specify the following:
-
Data Source for Report Layout - Use this option to download a report definition export file. Select XML Data or XML Schema and then click Download.
XML Schema creates XSD file (that is, a XML schema definition of your XML structure.)
-
Add Query - Click this button to add another query to the report query. Adding another query enables the production of complex reports with more than one output component (for example, a chart and a report based on two different queries).
-
Create Report Query - Click this button to exit the wizard early. The Report Layout Source will default to use the generic report layout.
-
Click Next.
-
-
For Upload Report Layout, specify the following:
-
Report Layout Source - Specify how the report layout is derived. If you choose the report based file layout then the layout name and report layout file must be provided.
-
Layout Name - Enter a layout name (optional). The default is the report query name.
-
Report Layout File - Click Browse and select a Rich Text Format (RTF).
-
Click Next.
-
-
For Confirm:
-
Query Name - Identifies the query.
-
Report Layout - Identifies the report layout you selected.
-
Output Format - Identifies the format for this report query.
-
Derive from Item - Identifies the item to hold the format information.
-
URL - To integrate this report with your application, use the displayed URL as the target for a button, list item, link, or other navigational component. End users can click a button, for example, to start the printing process.
-
Test Report - Click this to preview your report. If you have chosen to use a generic report layout then the Test Report will not produce an output.
-
Click Finish.
The Report Query is created and saved to Shared Components.
-
Editing Report Queries
To edit a report query:
-
Navigate to the Shared Components page. See "Accessing the Shared Components Page".
-
Under Reports, click Report Queries.
-
On the Report Queries page, you can use the Navigation bar at the top of the page to search for a query by name or change the page display. For example, you can change the default display by making a selection from View list. Available options include:
-
Icons (the default) displays each query as a large icon. To edit a query, click the appropriate icon.
-
Details displays each query as a line in a report. To edit a query, click the name.
-
-
Select the appropriate report query. On the Edit Report Query page, edit the information.
-
Click Apply Changes.
Copying Report Queries
To copy a report query:
-
Navigate to the Shared Components page. See "Accessing the Shared Components Page".
-
Under Reports, click Report Queries.
-
On the Report Queries page, click Copy.
-
On the Copy Report Query, select the query you want to copy, enter a name for the report query, and click Copy.
The copy appears in the query list.
About Report Layouts
To format either a classic report region or report query, you associate it with a report layout. Using report layouts renders the data in a printer-friendly format. If you do not select a report layout, a default XSL-FO layout is used. The default XSL-FO layout is always used for rendering Interactive Report regions.
When creating and using report layouts, you can:
-
Take advantage of the default layouts for report regions and generic layouts for report queries provided with Oracle Application Express.
-
Utilize the built-in XSL-FO-based layouts for report regions by copying and customizing the code. You can edit a number of attributes for report regions that control page size, fonts, colors, and so on.
-
Create RTF or XSL-FO report layouts to customize the report look and feel. To use RTF report layouts, your Oracle Application Express service administrator must select the Advanced setting for your site. See "Configuring Report Printing" in Oracle Application Express Administration Guide.
Topics in this section include:
About Report Layout Options
You can create a report layout based on one of these options:
-
Generic Columns - A generic report layout works with most query result sets. With this layout, the number of columns is automatically adjusted when generating the printable document.
A number of report layout attributes can be defined declaratively for report regions using the built-in XSL-FO default layout. This step allows for creating customizable copies of the built-in default XSL-FO layout, if additional control over the report layout is needed.
-
Named Columns - A named column report layout is a query-specific report layout designed to work with a defined list of columns in the query result set. This type of layout is used for custom-designed layouts when precise control of the positioning of page items and query columns is required.
Note that the availability of the Report Layout options depends on how your site administrator configured the report printing settings at your site. All options described in these steps may not be available to you.
See Also:
"Configuring Report Printing" in Oracle Application Express Administration Guide.Creating a Report Layout
To create a report layout:
-
Navigate to the Shared Components page. See "Accessing the Shared Components Page".
-
Under Reports, click Report Layouts.
-
Click Create.
The Create Report Layout wizard appears.
-
For Report Layout Type, select an option and click Next:
-
Generic Columns (XSL-FO) - This layout is pre-populated with a default template, which you can edit to fit your needs.
-
Named Columns (RTF) - This layout is uploaded as an RTF file.
-
Named Columns (XSL-FO) - This layout is uploaded as an XSL-FO file.
-
-
For Layout Source, review and edit the appropriate information. The options that appear on this page depend on the layout type you select:
-
If you selected Generic Columns:
-
Report Layout Name - Enter a name to identify the report layout when associating it with a report query or report region.
-
Report Layout - The report layout is the XSL-FO based definition of the page formatting. All attributes defining page size, orientation, fonts, styles, and so on, are defined in this section.
To see a list of valid substitution strings and other information, click the item label, Report Layout. This opens a separate Help window.
-
Report Column Heading - Defines the look of each cell in the report heading row.
-
Report Column - Defines the look of each cell for all report rows.
-
Report Column Width - This width is computed at runtime time or can be derived from the report column definition of a report region.
-
If you selected Named Columns:
-
Layout Name - Enter a name to identify the report layout when associating it with a report query or report region.
-
8.b) Report Layout File - Upload the file containing the report layout.
-
Editing Report Layouts
You can edit a generic column report layout directly in Application Express. However, to edit a named column report layout, you must download the current file, edit it, and then upload it again.
To edit a report layout:
-
Navigate to the Shared Components page. See "Accessing the Shared Components Page".
-
Under Reports, click Report Layouts.
-
On the Report Layouts page, select the layout you want to edit.
-
For generic column layouts, edit the layout directly on the Edit Report Layout page and then click Apply Changes.
-
For named column layouts, click Download and save the file to your computer.
Edit the file and then upload the updated version as a new report layout.
Copying Report Layouts
You can copy a report layout to edit and save.
To copy a report layout:
-
Navigate to the Shared Components page. See "Accessing the Shared Components Page".
-
Under Reports, click Report Layouts.
-
On the Report Layouts page, click Copy.
-
On the Copy Report Layout page, select the layout you want to copy, enter a name for the copy, and click Copy.
The copy appears in the layout list.
Configuring Classic Report Region Print Attributes
One approach to printing a report region is to configure Print Attributes. Once configured, these attributes only apply only to current region and cannot be used outside the context of the region.
If the printing feature is set up for your instance, you can configure a report region to print in various formats.
See Also:
"About Classic Report Printing Methods" and "Configuring Report Printing" in Oracle Application Express Administration GuideTo configure a classic report region for printing:
-
In your application, select the page containing the classic report region you want to print.
The Page Definition appears.
-
Under Regions, click Report next to the region you want to print.
-
Click the Print Attributes tab.
-
Under Printing, specify the appropriate information:
-
Enable Report Printing - Select Yes.
-
Link Label - Enter the text for the link that starts the printing process.
-
Response Header - Specify whether the response header generated by Oracle Application Express is based on your Report Settings or the Print Server. The response header is the information the server sends back to the Web browser in response to receiving an HTTP request. It contains the date, size and type of file that the server is sending back to the client and also data about the server itself. To specify content disposition (using the attribute View File As) and file name, the response header needs to be based on Report Settings.
-
View File As - Select how the Web browser opens the report query document. Options include:
-
Attachment - Displays a File Open/Save dialog box when the user clicks the report query download button.
-
Inline - Displays the report query document inside the Browser window.
-
-
(Optional) File Name - Enter a name for the downloaded file. If you leave this blank, the region name is used as the file name.
-
Output Format - Select an output option.
-
Item - Determines the output format at runtime. Select the application or page item that holds format value.
-
Report Layout - Select Default Report Layout to use the built-in generic report layout, or an available report layout you or your administrator created. See item Help for a listing of the supported substitution strings available when building custom XSL-FO report layouts.
-
Print Server Overwrite - Specify an alternate print server. A print server is typically configured centrally for all workspaces in Oracle Application Express Administration Services. See "Configuring Report Printing" in Oracle Application Express Administration Guide.
Configuring an alternative print server at the report level makes debugging and diagnosis of potential printing problems easier and supports the use of specific custom built end points to perform custom XSLT transformations.
-
Print URL - Report regions can be printed using the standard print link or using a page button. To use a button, remove the Link Label, create a button on your page, and use the URL shown in this attribute as the button target.
-
-
In the remaining sections, define page size, paper orientation, page headers and footers, fonts, text color, and background color.
-
Under Report Columns, specify the width for each column.
The default is to make each column the same width. The Total Width is a display only field that shows the sum of all column width values. When changing the width for an individual column the Total Width is automatically recalculated. If Column Width Units is set to Percentage, rather than Points, then the total column width must be less than or equal to 100.
Use the Reset Column Width button to reset the Column Width Units to Percentage and change all column widths back to their default value. The Recalculate button maintains the current ratios between column widths but reduce all column widths such that the Total Width is less than or equal to 100%.
-
Click Apply Changes.
Configuring Interactive Report Region Print Attributes
Unlike classic reports, the Interactive Report Print Attributes can only utilize the default XSL-FO layout and is initiated from the Report Attributes, Download section rather than directly from this screen. Once configured, these attributes only apply only to the current region and cannot be used outside the context of the region.
If the printing feature is set up for your instance, you can configure a report region to print in various formats
To configure a interactive report region for printing:
-
In your application, select the page containing the interactive report region you want to print.
The Page Definition appears.
-
Under Regions, click Interactive Report next to the region you want to print.
-
Click the Print Attributes tab.
-
Under Printing, specify the appropriate information:
-
Response Header - Specify whether the response header generated by Oracle Application Express is based on your Report Settings or the Print Server. The response header is the information the server sends back to the Web browser in response to receiving an HTTP request. It contains the date, size and type of file that the server is sending back to the client and also data about the server itself. To specify content disposition (using the attribute View File As) and file name, the response header needs to be based on Report Settings.
-
Content Disposition - Select how the Web browser opens the report query document. Options include:
-
Attachment - Displays a File Open/Save dialog box when the user clicks the report query download button.
-
Inline - Displays the report query document inside the Browser window.
-
-
Print Server Overwrite - Specify an alternate print server. A print server is typically configured centrally for all workspaces in Oracle Application Express Administration Services. See "Configuring Report Printing" in Oracle Application Express Administration Guide.
Configuring an alternative print server at the report level allows for easier debugging and diagnosis of potential printing problems and supports the use of specific custom built end points to perform custom XSLT transformations.
-
-
In the remaining sections, define page size, paper orientation, page headers and footers, fonts, text color, and background color.
-
Click Apply Changes.